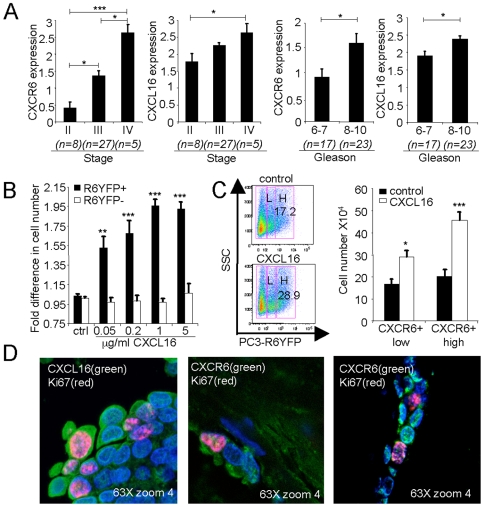
Figure 2. Roles for CXCL16 and CXCR6 in prostate cancer stage, grade and cell growth.
(A) Arrays containing prostate cancer tissue from 40 patients were stained for CXCL16 and CXCR6. Samples were scored for CXCL16 and CXCR6 expression as described in Materials and Methods. Samples were grouped according to stage or Gleason score (X-axes) as determined by the supplier, and mean scores for CXCL16 and CXCR6 expression were calculated. The number of samples (n) in each stage or Gleason score group is shown. Error bars show SEM. Cross-bars indicate comparisons that are significant. *, p<0.05 and ***, p<0.001. (B) PC3 cells were transfected with the CXCR6-YFP plasmid, cultured for 48 hours without chemokine (control, ctrl) or with 0.05–5 µg/ml CXCL16 and numbers of CXCR6-YFP+ (R6YFP+) vs. CXCR6YFP− (R6YFP−) cells were counted as described in Materials and Methods. Values were normalized to the control, untreated sample to yield the fold difference in cell number. Bars show means±SEM combined from three experiments. **, p<0.01 and ***, p<0.001 vs. control values. (C) Following transfection with the CXCR6-YFP plasmid, PC3 cells were cultured as in (B), without or with 5 µg/ml CXCL16. Left panel, gating is shown for separating untreated and CXCL16-treated cells into “low” (L) or “high” (H) for CXCR6-YFP. Percentages of cells in the high gates are shown. One representative experiment is shown out of three performed. Right panel, CXCR6-YFP+low (CXCR6+low) and CXCR6-YFP+high (CXCR6+high) cells from CXCL16-treated and control cultures were counted after 48 hours as in (B). Data were combined from three experiments. *, p<0.05 and ***, p<0.001 vs. untreated cells. (D) Confocal imaging displays anti-CXCL16 or anti-CXCR6 (488 tyramide) as green, anti-Ki67 (594 tyramide) as red, and nuclear staining with Hoechst 33258 as blue. Panel is representative of more than 15 cases.

