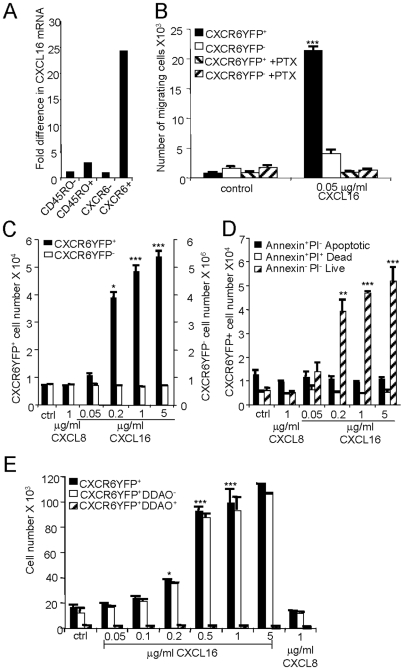
Figure 5. CXCL16 can mediate the migration and proliferation of T cells expressing CXCR6.
(A) CD4+ T cells were sorted into naïve (CD45RO-), total effector/memory (CD45RO+), CD45RO+CXCR6− (CXCR6-) and CD45RO+CXCR6+ (CXCR6+) subsets and stimulated with PMA and ionomycin for 4 hours before measuring levels of CXCL16 mRNA by real-time RT-PCR. Values were normalized by setting the sample with lowest expression equal to 1. The data are means from duplicate samples from one representative experiment out of three performed. (B) Jurkat E6.1 T cells transfected with the CXCR6-YFP plasmid were analyzed for migration to CXCL16. Some samples were pre-incubated for two hours with 400 ng/ml pertussis toxin as indicated. Numbers of YFP+ and YFP- migrating cells were analyzed by flow cytometry. Each bar represents the mean±SEM obtained from triplicate wells, from one representative experiment of three performed. ***, p<0.001 vs. the corresponding control value. (C) Following transfection with the CXCR6-YFP plasmid, Jurkat E6.1 T cells were cultured for 48 hours without chemokine (control, ctrl) or with 1 µg/ml CXCL8 as an additional control, or with 0.05–5 µg/ml CXCL16 before counting numbers of CXCR6-YFP+ vs. CXCR6-YFP− cells. Bars show means±SEM combined from three different experiments. *, p<0.05 and ***, p<0.001. (D) Transfected cells were treated as in (C) and stained with Annexin V and propidium iodide (PI) before counting numbers of CXCR6-YFP+ cells within the subgroups as noted. Bars show means±SEM combined from three experiments. **, p<0.01 and ***, p<0.001 vs. control untreated cells. (E) Following transfections with CXCR6-YFP plasmid, Jurkat E6.1 T cells were loaded with 2 µM Far Red DDAO dye and cultured without chemokine (control, ctrl) or with 0.05–5 µg/ml CXCL16 or 1 µg/ml CXCL8. Numbers of CXCR6YFP+ vs. CXCR6YFP+DDAO− (proliferated) and CXCR6YFP+DDAO+ (non-proliferated) cells were determined after 48 hours using counting beads and flow cytometry. Bars show means±SEM from triplicate wells, from one representative experiment of three performed. ***, p<0.001 and *, p<0.05 vs. control untreated cells.

