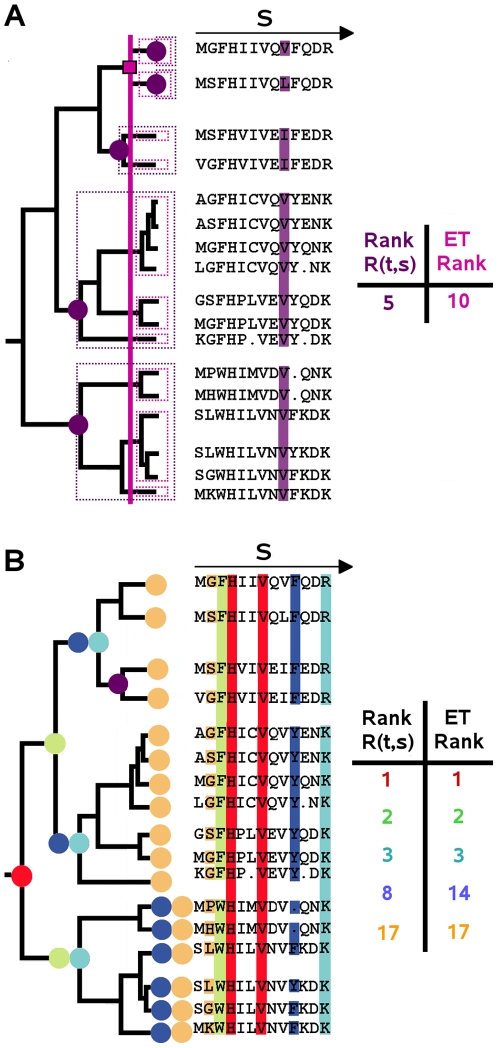
Figure 1. MSTs and ranks illustrated in a sequence alignment and associated distance tree T.
A. Analysis of conservation at position s = 9 in the sequence alignment, MST rank  and ET rank (as defined in [20]). The 5 MSTs conserving residues at position 9 are delimited by purple dotted lines and their roots are represented by purple circles. The 10 subtrees identified by the ET approach are delimited by pink dotted lines and the node determining the rank of conservation of the 9th position is indicated by a pink square. B. Analysis of 6 different alignment positions marked with distinguished colors in the alignment and in the tree. The rank
  , its corresponding ET rank and the roots of MSTs decomposing T with respect to position s are colored the same way.

