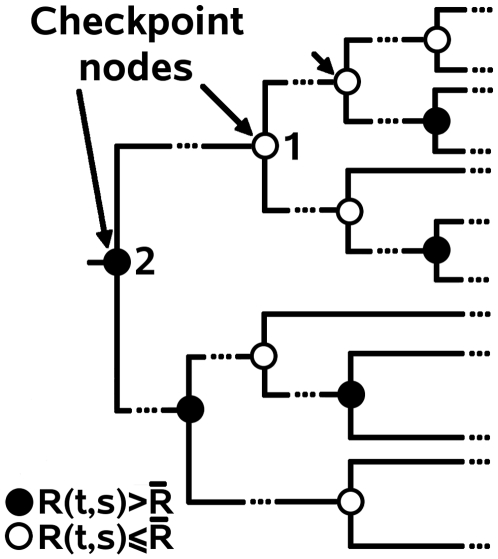
Figure 2. Checkpoint nodes.
Distance tree with checkpoint nodes colored differently depending on the conserved status of a position s in the subtree t rooted at the checkpoint node: grey if s is not conserved, and white if s is conserved. All nodes in the tree which are not checkpoint nodes, and that are possibly located between two checkpoint nodes, are not indicated. At the white checkpoint node 1, the longest monochromatic path starting at 1 and going towards the leaves has length 3. This asks for  to be incremented by 3. At the grey checkpoint node 2, the longest monochromatic path starting at 2 and going towards the leaves has length 2, and this asks for
  to be decremented by 2.

