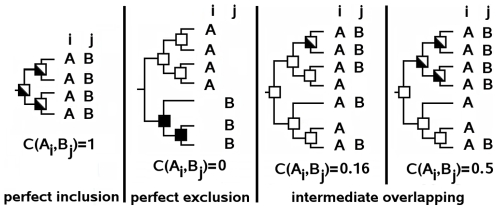
Figure 3. Overlap of MSTs and correspondence scores.
Different inner trees specific of residues A and B at positions i and j and their corresponding correspondence scores. White squares identify nodes of  (leaves excluded) and black squares identify nodes of
  . White and black squares identify common nodes between
  and
and  . The first two trees illustrate perfect inclusion and exclusion. The last two trees illustrate intermediate cases where the number of sequences with residues A and B are equal but correspondence scores are different due to a different distribution of sequences in the tree.

