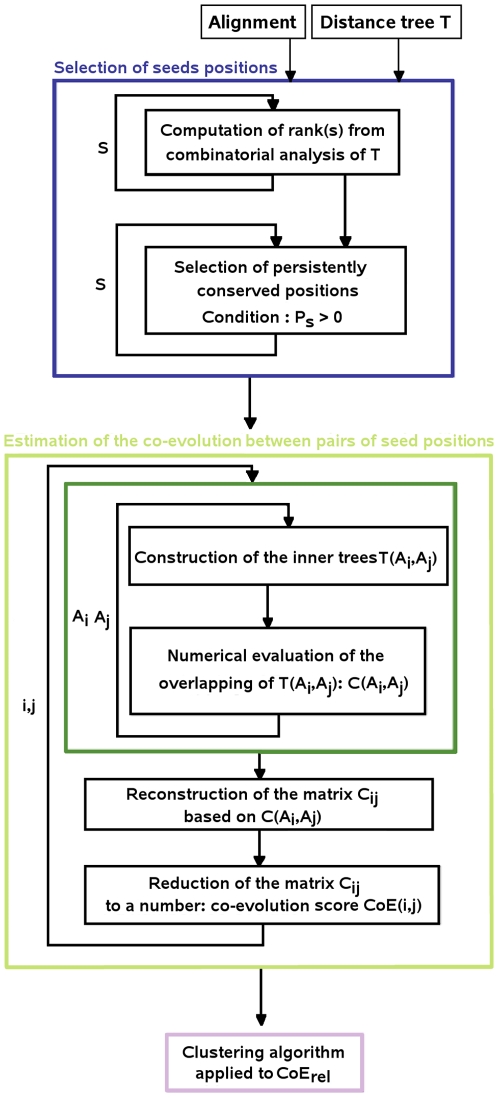
Figure 7. Flowchart of the analysis.
The main algorithmic steps of the analysis are represented by three colored boxes. Blue: selection of seed positions; the index s runs over all alignment positions. Green: estimation of coevolution between pairs of seed positions; indices  run over seed positions only. Cyan: clustering algorithm; details of the algorithm are presented in Figure 9.

