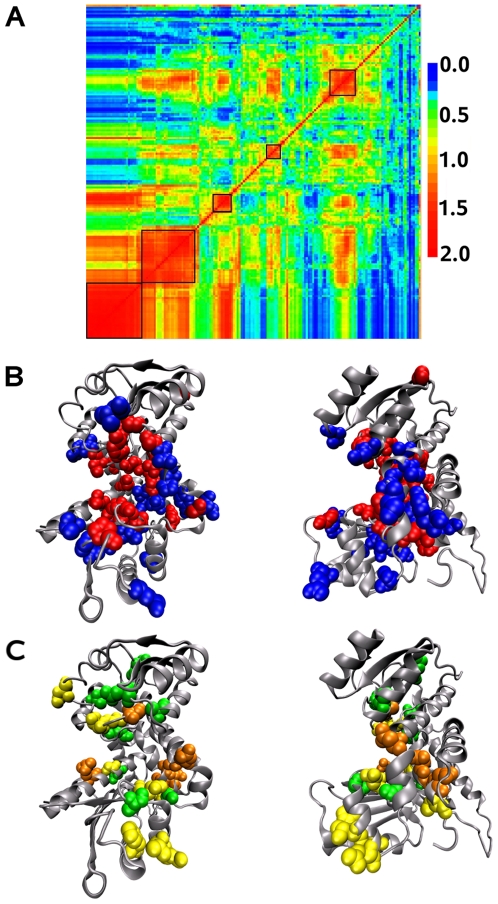
Figure 12. Leucine dehydrogenases.
A: Matrix of relative coevolution scores  for the leucine dehydrogenase family. The 5 identified networks have been manually selected on the matrix. Signals for detection are noisy and errors in clustering positions are likely; due to red scores, the last position of the matrix, for instance, seem misplaced and better clustered with positions appeared before in the matrix. Despite the intrinsic difficulty in detection, the strong difference in signals among networks, globally justifies all five. The first and third networks display similar signals (see red scores along the associated columns and rows) but each of them shares different signals with the second network. The same is observed for the fourth and the fifth networks with respect to the third one. BC: Coevolved residues networks on the Bacillus sphaericus leucine dehydrogenase structure 1LEH (chain B). The catalytic site is illustrated on the front (left) and on the side (right); B: network associated to the catalytic function (red, first in A) and network associated to ligand specificity (blue, second in A); C: third (green), fourth (orange) and fifth (yellow) networks detected in A.

