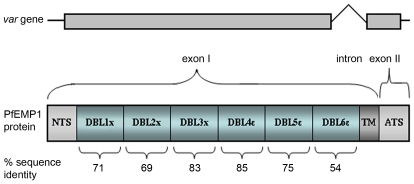
Figure 1. Structure of the var2csa gene and protein.
The gene and its exon structures are shown above a protein diagram which has been subdivided into predicted domains [71]. The approximate amount of variation (expressed as percentage amino acid identity) in these domains is shown below each domain block. The sequence similarities were calculated based on the genome sequencing data available (from 3D7, FCR3/It4, HB3, Dd2, PfClin, and P.reichenowi). The trans-membrane region and conserved (>95%) intracellular acidic terminal sequence (ATS) are not included in the analysis.

