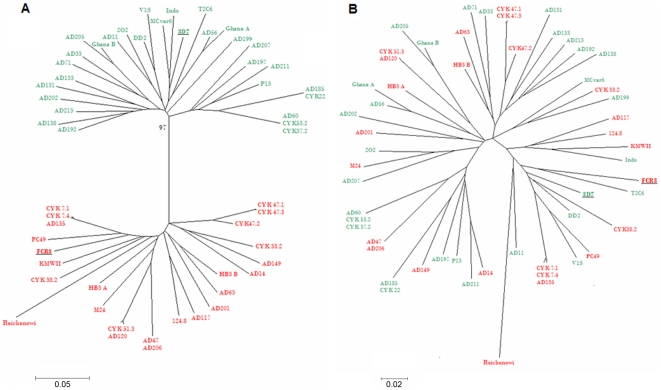
Figure 4. Phylogenetic relationships between 44 VAR2CSA DBL2X sequences.
A. Neighbor joining tree illustrating the phylogenetic relationship between the sequences, with representatives of each of the two DSM variants marked in separate colors. 3D7-type sequences are shown in red and FCR3/It4-type in green. The bootstrap value is shown at the main bifurcation. B. Neighbor joining tree based on the same sequences, after excision of the DSM region. The 3D7/red, FCR3/It4/green variant-type coding is maintained.

