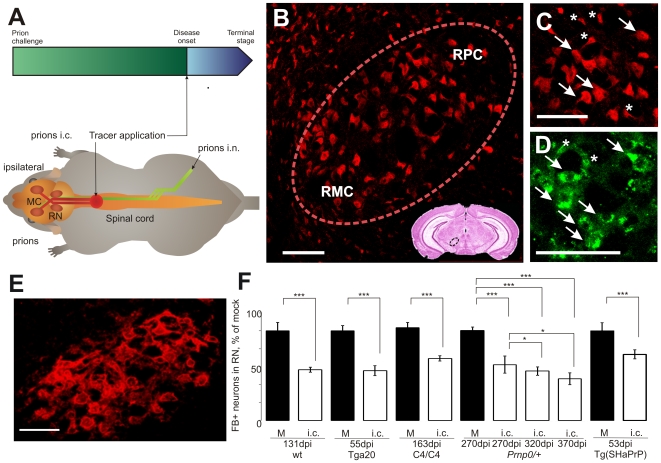
Figure 1. Quantification of retrogradely labeled neurons reveals significant alterations upon prion challenge.
(A) Mice were challenged with prions intracerebrally (prions i.c.) or into the right sciatic nerve (prions i.n.). The axonal tracers were applied into the spinal cord before the onset of clinical disease. Retrogradely labeled tracer-positive neurons were quantified in the red nucleus (RN) and motor cortex (MC). (B) The NeuN-positive neurons in the RN (within the dashed line). The RN is a clearly defined center in the midbrain. It is divided into two parts, magnocellular (RMC) and parvicellular (RPC) in the section shown. Small box: anatomic localization of RN on coronal brain section stained with hematoxilin-eosin. (C) Enhanced part of B. The large pyramidal motor neurons projecting via spinal cord were quantified (arrows), but not the smaller ones (asterisks). Scale Bar: 100 µm (D) Fast Blue-positive neurons in the RN. The big pyramidal cells possessed several deposits of FB in the cytoplasm (arrows) and were quantified on z-stacks done on serial cryo-sections. Analysis of z-stacks allowed us to reliably rule out the artifacts (asterisks) from the quantification. Scale bar: 100 µl. (E) Wisteria floribunda agglutinin-positive cells are typical for the RN and a proof for the correct localization of tracer-positive neurons. (F) Bilateral reduction of FB-positive (FB+) neurons was observed in the RN of different mouse lines upon intracerebral (i.c.) prion challenge. FB was applied at indicated number of days post prion inoculation (dpi). For the times of disease onset and terminal stage as well as numbers of quantified neurons, see Tables S1 and S2. M – mock, wt – wild type. Unpaired t-test was done using GraphPad Prism software. *** – P<0.0001, * – P<0.02.

