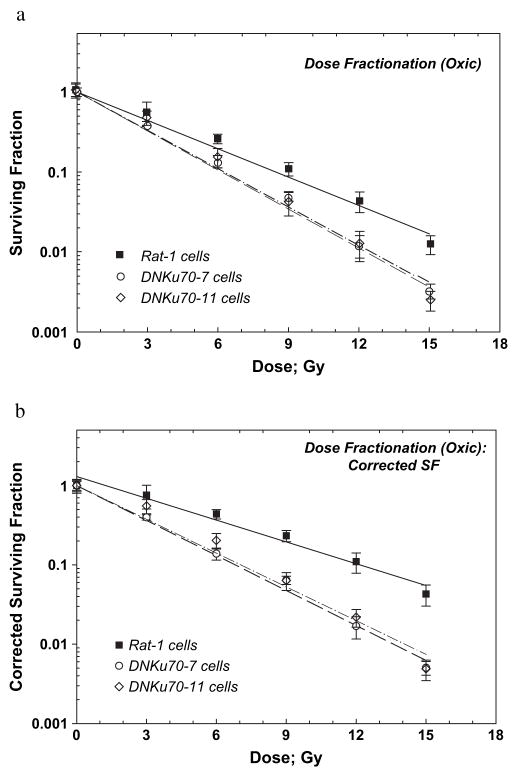
Fig. 4.
Radiation dose–cell survival curves for Rat-1 (solid squares), DNKu70-7 (open circles), and DNKu70-11 (open diamonds) cells receiving 0–5 doses of 3 Gy each under oxic conditions. The first radiation dose was given 3 days after cell plating, and the interfraction interval was 6 h. Cells were trypsinized 6 h after each final dose for colony formation assay. Cell survivals are shown without correction for the change in cell numbers (a) and with correction (b).

