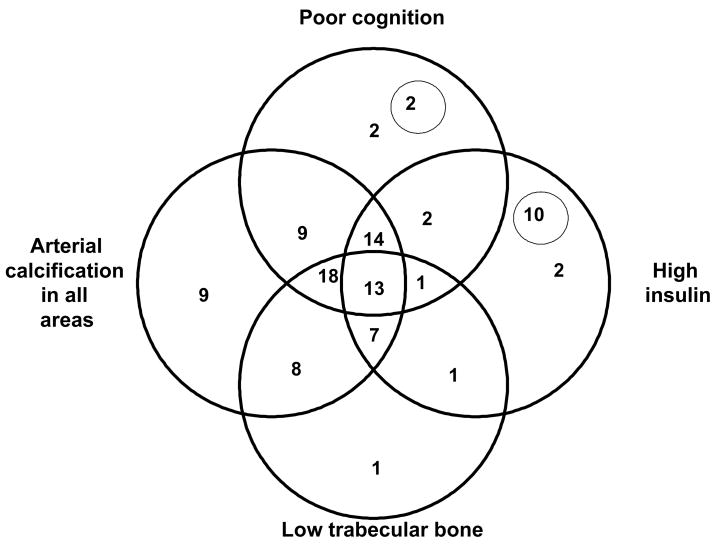
Figure 1. Independence and overlap of prevalent phenotypes in the AGES-Reykjavik Study, 2002–2004.
Phenotypes from the Age, Gene/Environment Susceptibility Study (AGES-Reykjavik) are represented by the overlapping circles in this figure, representing the traits of poor cognition, arterial calcification in all areas, high insulin, and low trabecular bone. The phenotypes are further defined in Methods section. Numbers within the circles represent the percent of the cohort with each of these traits. Numbers in areas of overlap indicate the percent of the cohort that has more than one trait. Two percent of the cohort had none of the phenotypes and only 13 percent share all the traits. The number inside the small circle within the ‘poor cognition’ phenotype represents the percent of the cohort which had both poor cognition and low trabecular bone. Similarly, the number inside the small circle within the ‘high insulin’ phenotype represents the portion of the cohort that has both high insulin and arterial calcification in all areas.

