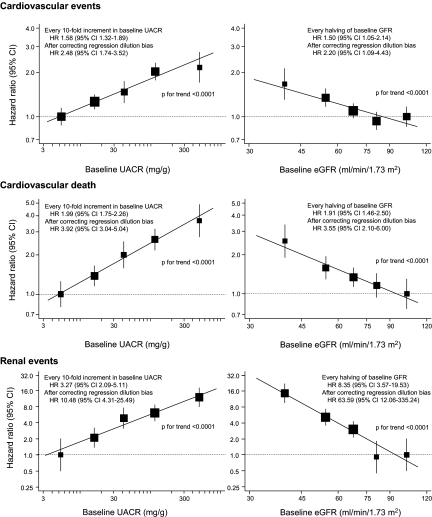
Figure 1.
Association of albuminuria level or eGFR at baseline with the risk for adverse outcomes. The centers of the square are placed at the point estimates, and vertical lines represent the corresponding 95% CIs. The area of each square is proportional to the inverse variance of each estimate. The estimates are adjusted for baseline covariates, including age, gender, duration of diabetes, log-transformed eGFR (or log-transformed UACR), SBP, history of currently treated hypertension, history of macrovascular disease, HbA1c, LDL cholesterol, HDL cholesterol, log-transformed triglycerides, body mass index (BMI), electrocardiogram abnormalities, current smoking, and current drinking. The hazard ratios (HRs) and 95% CIs for the regression lines were corrected with the regression dilution attenuation coefficient of log-transformed UACR (1.98) and log-transformed eGFR (1.96).

