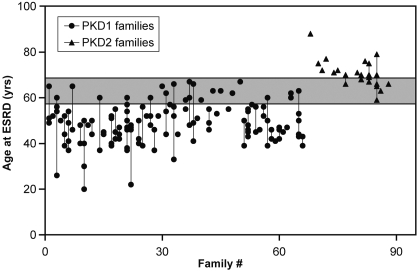
Figure 2.
Age plot for affected study participants who developed ESRD, grouped by family. Each dot within a vertical line represents the age at which an affected member of the same family developed ESRD. Significant intrafamilial variability is noted with the gray zone denoting the age range at which both patients with PKD1 and PKD2 overlap, presumably as a result of a modifier effect from genetic and environmental factors; however, having at least one family member who developed ESRD at or before the age of 58 is highly predictive of PKD1. Conversely, having at least one family member who developed ESRD at or after the age of 68 is highly predictive of PKD2,

