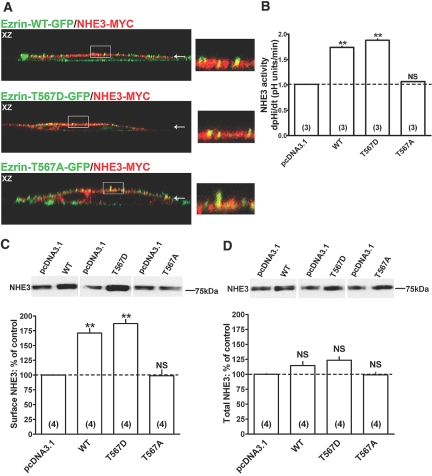
Figure 6.
Effect of Ezrin-WT and Ezrin-T567D expression on surface NHE3 activity and protein. (A) Colocalization of myc-tagged NHE3 (NHE3-MYC) with eGFP-tagged Ezrin-WT (Ezrin-WT-GFP), Ezrin-T567D (Ezrin-T567D-GFP), or Ezrin-T567A (Ezrin-T567A-GFP). In the XZ cross-sections, apical localization is indicated by an arrow. Colocalization is reflected by a yellow signal of the merged composite. The area indicated by a rectangle in the XZ cross-sections is magnified in the inset. NHE3 activity, NHE3 surface, and total protein were quantified as described in the legend of Figure 1. Myc-tagged Ezrin-WT (WT), Ezrin-T567D (T567D), and Ezrin-T567A (T567A) transfected cells were compared with empty-vector-transfected cells (pcDNA3.1): (B) NHE3 activity. (C) NHE3 surface protein. (D) NHE3 total protein. Representative immunoblots and summary of data are shown. Results are expressed as dpHi/dt (pHi units/min) for NHE3 activity and percentage of control for NHE3 surface and total protein. Bars and error bars represent means and standard errors. The number of experiments performed under identical conditions is in parentheses. **P < 0.01 ANOVA compared with control. NS, statistically insignificant compared with control.

