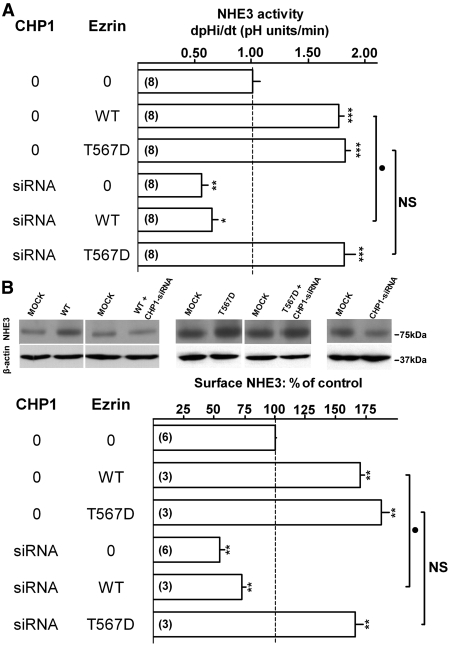
Figure 7.
Effect of CHP1 knockdown on ezrin-mediated activation of NHE3 function. NHE3 activity, NHE3 surface protein, and β-actin total protein were quantified as described in the legend of Figure 1. Representative immunoblots and summary of data are shown. Antigen signals were normalized to β-actin. Results are expressed as dpHi/dt (pHi units/min) for NHE3 activity and percentage of control for NHE3 surface protein. Bars and error bars represent means and standard errors. The numbers in parentheses refer to the number of experiments performed under identical conditions. *P < 0.05/**P < 0.01/***P < 0.001 ANOVA compared with control. •P < 0.05 ANOVA cells transfected with Ezrin-WT (WT) compared with cells cotransfected with CHP1-siRNA and Ezrin-WT (WT). NS, evoked change in cells transfected with Ezrin-T567D (T567D) is not significantly different compared with cells cotransfected with CHP1-siRNA and Ezrin-T567D (T567D). 0 indicates transfection of scrambled siRNA in the CHP1 column or empty-vector in the ezrin column. Myc-tagged Ezrin-WT and variants were expressed in OK cells. (A) NHE3 activity. (B) NHE3 surface protein and β-actin total protein.

