Summary
S100A13 is a 98 amino acid, calcium binding protein. It is known to participate in the non-classical secretion of signal peptide-less proteins, such as the acidic fibroblast growth factor (FGF-1). In this study, we investigate the lipid binding properties of S10013 using a number of biophysical techniques, including multidimensional NMR spectroscopy. Isothermal titration calorimetry and steady state fluorescence experiments show that apoS100A13 exhibits preferential binding to small unilamelar vesicles of L-phosphatidyl serine (pS). In comparison, Ca2+-bound S100A13 is observed to bind weakly to unilamelar vesicles (SUVs) of pS. Equilibrium thermal unfolding and limited trypsin digestion analysis reveal that apoS100A13 is significantly destabilized upon binding to SUVs of pS. Results of the far UV circular dichroism and ANS (8-anilino-1-napthalene sufonate) binding experiments indicate a subtle conformational change resulting in the increase in the solvent-accessible hydrophobic surface in the protein. Availability of the solvent-exposed hydrophobic surface(s) in apoS10013 facilitates its interaction with the lipid vesicles. Our data suggest that Ca2+ binding dictates the membrane binding affinity of S100A13. Based on the results of this study, a model describing the sequence of molecular events that possibly can occur during the non-classical secretion of FGF-1 is presented.
Keywords: Acidic Fibroblast growth factor, calcium binding, lipid binding, non-classical secretion, multi-protein complex, hydrophobic
Fibroblast growth factors (FGFs) are heparin binding proteins that are involved in the regulation of a number of crucial biological processes such as, angiogenesis, morphogenesis, wound healing, and tumor growth [1,2,3]. FGFs exhibit their biological activity by binding to their specific cell surface protein kinase receptors, and therefore are required to be released into the extracellular compartment [3, 4, 5]. Interestingly, the prototypical members of the FGF family, lack the conventional N-terminal sequence required for their release into the extracellular compartment through the classical endoplasmic recticulum (ER)-Golgi secretion pathway [6–9].
FGF-1 is not released into the extracellular medium under normal conditions. However, cells release FGF-1 under stress conditions such as hypoxia, heat shock, cultivation under low serum conditions, and upon treatment with low-density lipoproteins [10–13]. The export of FGF-1 into the extracellular compartment is not inhibited by brefeldin A, a classic inhibitor of the ER-Golgi dependent protein secretion [10, 14, 15]. Similarly, the extracellular secretion of FGF-1 is resistant to methylamine, an inhibitor of exocytosis [15]. In addition, the release of FGF is inhibited by deoxyglucose suggesting that the release pathway is independent of ATP [6, 16]. Similarly, the extracellular secretion of FGF-1 is resistant to methylamine, an inhibitor of exocytosis [15], and to sulfonyl glybenclamide, an inhibitor of the mammalian ATP-binding cassette translocator [17]. Therefore, the secretion of FGF-1 is believed to occur via a non-classical route that is independent of the classical ER-Golgi export pathway.
Studies on NIH3T3 cells revealed that the stress-induced release of FGF-1 is sensitive to inhibition by copper (Cu2+) chelator, tetrathiomolybdate (TTM), suggesting that intracellular Cu2+ plays an important role in the non-classical release of FGF-1 [7]. In vitro, Cu2+ induces formation of covalent FGF-1 homodimer [18]. Jackson et al showed that intracellular Cu2+ is responsible for the oxidation of the well conserved Cys30 (in FGF-1) to form an intermolecular disulfide bond leading to the formation of a homodimer of FGF-1 [19]. FGF-1 homodimer exhibits insignificant heparin binding, as well as low mitogenic activity [19].
The release of FGF-1 in response to heat shock requires the Cu2+-mediated formation of FGF-1 homodimer as well as the association of FGF-1 with S100A13, a member of the family of small calcium-binding EF hand-containing proteins, and with the extravesicular p40 fragment of p65 synaptotagmin (p40Syt1), an integral transmembrane protein that participates in secretory vesicle docking [6, 20–22]. Prudovsky et al., using real time confocal microscopy studies demonstrated stress-induced peripheral translocation of FGF-1, S100A13 and Syt1 and their co-localization in the vicinity of the cell membrane [23]. HPLC analysis of the FGF containing fractions of the bovine and ovine brains also showed the presence of the multiprotein complex containing FGF-1, S100A13 and p40 Syt1 [24].
S100A13, like FGF-1, lacks the classical signal sequence [6, 24]. S100A13 has been shown to be spontaneously released from transfected NIH 3T3 cells [24, 17]. A dominant deletion mutant of S100A13 lacking the C-terminal domain, rich in basic amino acids, failed to support the stress-induced release of FGF-1 [6, 25, 17]. Although the cysteine-free mutant of FGF-1 is unable to be released in response to stress, the coexpression of S100A13 facilitates its export [17]. It is believed that S100A13 binds to FGF-1, and aids in its translocation across the membrane bilayer [6]. Interestingly, some members of the S100 family of proteins have been reported to form a diverse and protein-specific pattern of membrane and lipid raft association [26]. Recently, Graziani et al., studying protein-induced carboxyfluorescein release from liposomes of different phospholipid (pL) compositions, demonstrated that S100A13 induced destabilization of liposomes composed of acidic but not of zwitterionic pL [27]. However, to-date there is no structural evidence for the membrane binding properties of S100 proteins, including S100A13. In this context, in the present study, we report the membrane binding affinity of S100A13 using a number of biophysical techniques, including multidimensional NMR spectroscopy.
Materials and Methods
Escherichia coli [BL21 (DE3) pLysS] and pET20b (+) were purchased from Novagen. pGEX vector and GST–sepharose were obtained from GE Healthcare. Labeled 15NH4Cl and D2O were purchased from Cambridge Isotope Laboratories. Guanidium hydrochloride and 8-anilino-1-napthalene sulfonate (ammonium salt) were obtained from Sigma Chemical Co., St. Louis. All other chemicals used were of high quality analytical grade. Unless specified, all solutions were made in 10 mM tris (pH 7.5) buffer containing 100 mM NaCl.
Protein expression and purification
The amplified cDNA of S100A13 was inserted into a pGEX expression vector. The expression of S100A13 was carried out in Escherichia coli. 15N-labeled protein was prepared by growing the cells in M9-minimal medium containing 15N-labeled NH4Cl as the sole source of nitrogen. The expressed glutathione S-transferase (GST)-fused S100A13 was purified on a GST column(s). Apo-S100A13 preparations were made by repeated dialysis of the protein against EDTA. The absence of the metal was verified by isocompetition point mass. The GST tag was eliminated by thrombin (Sigma, St. Louis, MO) cleavage and the protein was re-purified by affinity chromatography on GST-sepharose and desalted (at room temperature) by size-exclusion chromatography on a Superdex-75 column using AKTA-FPLC (Amersham Biosciences, USA).
Preparation of SUV’s
Lipid vesicles were generated by drying chloroform solutions of pS under a stream of oxygen-free nitrogen, and then the last traces of organic solvent were removed under vacuum for at least 12 h. Dried phospholipids were resuspended in 10 mM tris pH 7.5 (containing 100 mM NaCl) by vigorous vortexing and then subjected to direct probe sonication (10 cycles of 15 s) to produce small unilamelar vesicles (SUVs).
Lipid titration experiment
The lipid titration experiments were performed using a Hitachi F-2500 spectrofluorometer at 25°C. Fluorescence spectra were recorded using an excitation wavelength of 280 nm and an emission wavelength range of 300–400 nm. The protein concentration was kept constant at 20 µM and the lipid was titrated to a final concentration of 200 µM. Necessary background corrections were made in all spectra.
8-Anilino-1-naphtalenesulfonate binding experiments
8-anilino-1 naphthalenesulfonate (ANS) titration experiments were performed using a Hitachi F-2500 spectrofluorometer at 25°C. Fluorescence spectra were recorded using an excitation wavelength of 390 nm and an emission wavelength range of 400–600 nm. The protein and lipid concentrations used were 10 µM and 100 µM, respectively. ANS was titrated in 20 µM increments from 0–460 µM. Control experiments were carried out under the same conditions without the protein.
Thermal denaturation
For the thermal denaturation experiments, the protein and lipid concentrations were 10 µM and 100 µM respectively. Denaturation of the protein was monitored using a Hitachi F-2500 spectrofluorometer at 25°C. Fluorescence spectra were recorded using an excitation wavelength of 280 nm and an emission wavelength range of 400–600 nm. The requisite temperatures in the thermal denaturation experiments were attained using a NesLab circulating water bath. Samples were equilibrated at each temperature for 5 minutes prior to data acquisition. Necessary background corrections were made in all spectra.
Circular Dichorism
All CD measurements were performed on a JASCO-720 spectropolarimeter using a quartz cell of 1 mm path length. Each spectrum was an average of 10 scans. The concentration of the protein used was 50 uM (in 10 mM tris containing 100 mM NaCl, pH 7.5). The final spectra were obtained after necessary blank corrections with 10 mM tris containing 100 mM NaCl, pH 7.5.
Proteolytic digestion
Proteolytic digestion experiments were carried out at 25°C using trypsin (Sigma) as the proteolytic enzyme, in the absence or presence of the pS (at 0.5 mM concentration). Proteolytic digestions were carried out at an enzyme/protein molar ratio of 1:1. The reaction was arrested at regular time intervals by the addition of the gel loading dye (Bio-Rad, Hercules, USA). The degree of proteolytic cleavage was estimated by densitometry of the intensity of the ~11-kDa band corresponding to the uncleaved S100A13. The intensity of the S100A13 band not subjected to the trypsin treatment was used as a control for 100% protection against trypsin cleavage.
NMR spectroscopy
NMR experiments were performed at 25 °C on Bruker Avance 700 MHz spectrometers equipped with four frequency channels and 5 mm triple resonance cryogenic probes. Spectra were recorded with 16 transients of 2048 data points and 128 t1 increments. Unless otherwise stated, solvent suppression was achieved by presaturation of the water signal during the relaxation delay, and quadrature detection in the indirectly detected dimensions was obtained with States-TPPI phase cycling. The concentration of S100A13 used was 0.1 mM. Protein samples were prepared in 90% H2O + 10% D2O containing 10 mM tris-d11 and 100 mM NaCl (pH 7.5). 2 mM Calcium was included in holoS100A13.
Isothermal titration calorimetry measurements
Binding of S100A13 to the pS was analyzed by measuring heat change during the titration of pS with S100A13 using a VP-ITC titration microcalorimeter (MicroCal Inc., Northampton, MA). All protein and ligand (pS) solutions were degassed under vacuum and equilibrated at 15 °C prior to titration. The sample cell (1.4 mL) contained 84 uM S100A13 dissolved in 10 mM tris buffer containing 100 mM NaCl (pH 7.5). The reference cell contained water. Lipid was titrated into the cell from the syringe, the contents of which were stirred at 310 rpm. A typical experiment consisted of 29 successive automatic injections of 10 uL each with a 300 s equilibration time between the injections. The first injection was ignored in the final data analysis. The resulting titration curves were corrected for the S100A13-free buffer control and analyzed using the software supplied by Microcal, Inc.
Results and Discussion
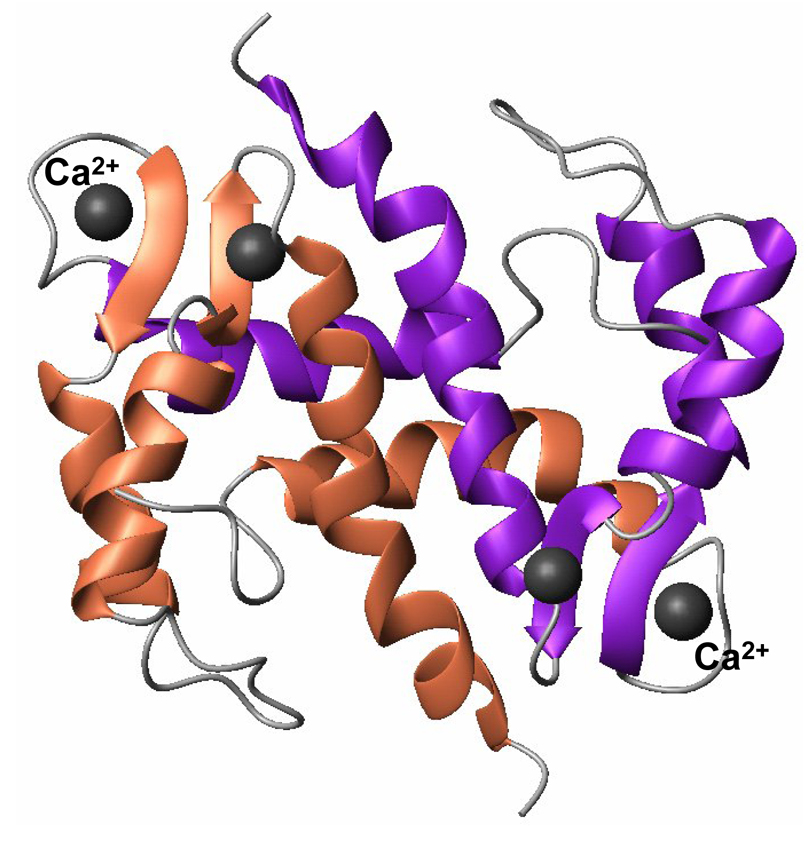
S100A13 is a small molecular weight (~ 11 kDa) calcium binding protein [28, 29]. It is a symmetrical homodimer and each monomeric unit consists of four helices organized in to two EF-hands (Fig. 1) [helix-loop-helix motif, Refs. 30, 31]. Two calcium ions bind at each of the EF-hand motifs [32]. The EF-hand located at the C-terminal end is rich in acidic amino acids and binds to calcium ions to form a pentagonal bipyramid type of coordination sphere [29, 30]. The dimeric interface is constituted by interactions of hydrophobic residues provided by helix H4 of one monomer with H1′ and H4′ helices of the other (Fig.1).
Fig. 1.
MolMol representation of the three-dimensional structure of S100A13 (PDB ID 1CXJ) bound to calcium. S100A13 is a dimer and each monomeric unit consists of four helices arranged in to two EF-hand motifs. Each EF hand motif binds to a Ca2+ ion. Residues involved in the calcium binding site form a beta-sheet type of structure.
ApoS100A13 exhibits preferential binding affinity to L-phosphatidyl serine (pS)
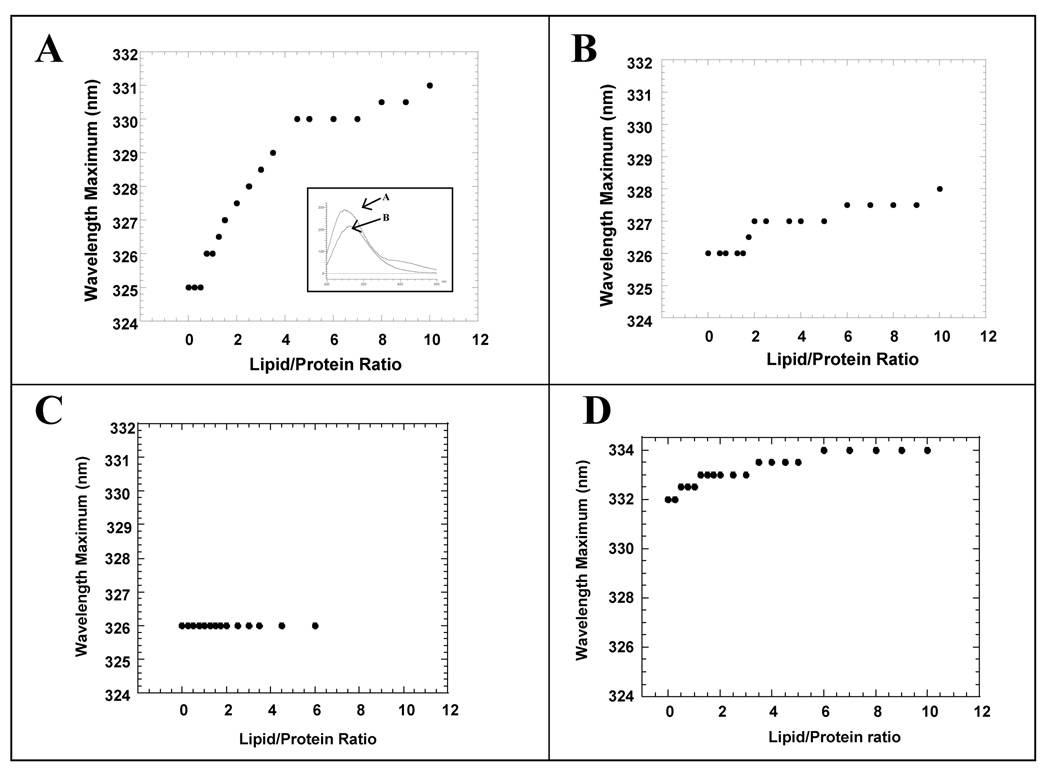
S100A13 contains one tryptophan residue at position 77 [30]. The tryptophan residue is located in a non-polar environment in the structure of S100A13. Therefore, it serves as an ideal probe to monitor conformational changes that possibly occur upon lipid binding. The fluorescence spectrum of apoS100A13 shows an emission maximum at a wavelength of 325 nm indicating that the tryptophan residue is buried in the interior of the protein (Fig. 2, inset). The wavelength of maximum emission (λmax) shows a progressive red shift in the presence of the small unilamelar vesicles (SUVs) of L-phosphatidyl serine (pS). The λmax does not significantly change beyond pS to apoS100A13 ratio of 5: 1 (Fig.2A). Interestingly, only a small change in the λmax (326 nm to 328 nm) is observed in the presence of SUVs of L-phosphatidyl glycerol (pG, Fig.2B). Similarly, no appreciable changes were observed in the λmax when apoS100A13 was titrated with SUVs of L-phosphatidyl choline (pC, Fig. 2C). These results clearly suggest that apoS10013 interacts with negatively charged SUVs of pS but not with the neutral vesicles of pG or the positively charged vesicles of pC. Surprisingly, titration of calcium bound S100A13 individually with SUVs of pS (Fig. 2D), pG and pC (data not shown) produced no discernable change in the λmax of the tryptophan fluorescence (of S100A13), suggesting that the protein does not interact significantly with any of the lipid vesicles used.
Fig. 2.
Binding of apoS100A13 to SUVs of, A - pS; B – pG and C –pC monitored by change(s) in the wavelength of maximum emission (λmax). The inset panel in panel – A shows the fluorescence spectrum of apoS100A13 in the absence (curve-A) and in the presence of 2 mM of Ca2+ (curve-B). Panel – D shows the titration of holoS100A13 and SUVs of pS monitored by changes in the λmax. The data clearly show that apoS100A13 exhibits a preferential binding to pS vesicles. In the presence of calcium, S100A13 has very low or no affinity to bind to pS vesicles. The concentration of protein used was 20 uM. All experiments were performed in 10 mM tris (pH 7.5) containing 100 mM NaCl. Fluorescence spectra were acquired upon excitation at 280 nm.
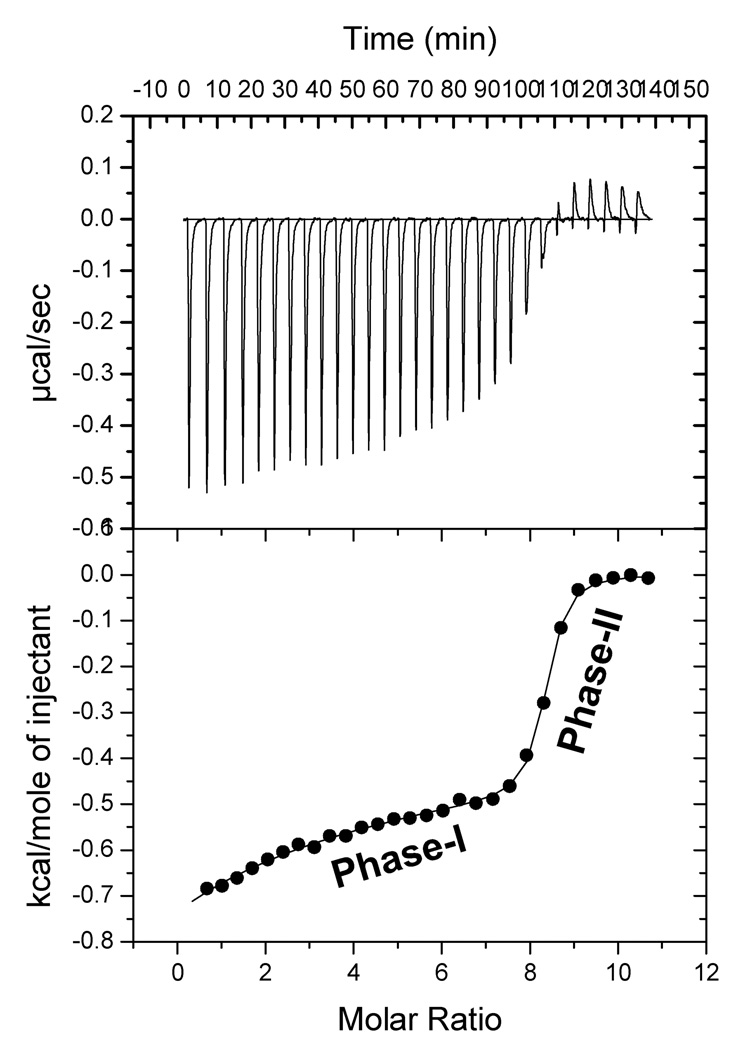
Isothermal titration calorimetry (ITC) is a versatile technique for the characterization of protein-protein or protein-ligand interactions [33]. ITC experiments provide direct information on the stoichiometry, binding affinity, and heat changes that occur during protein-ligand binding reactions in solution [33]. In this context, we monitored the binding affinity of S100A13 to individual small unilamelar vesicles of prepared individually from pS, pG and pC. Isothermogram representing the titration of apoS100A13 and pS vesicles is biphasic (Fig. 3). The interaction proceeds with the evolution of heat (ΔH = −0.38 kcal.mol−1). The first phase of binding is extremely weak in the millimolar range (Fig.3). The second phase of binding between apoS100A13 and pS vesicles is strong (Kdapp ~ 500 nm, Fig. 3). The entropy of the apoS100A13 – pS vesicle binding is characterized by decrease in entropy (ΔS = 27.5 cal.mol−1K−1) probably suggesting that the interaction is primarily occurs via charge-charge interactions. ApoS100A13 also exhibits weak binding to pG vesicles (Kdapp ~ 820 uM) (data not shown). In marked contrast, apoS100A13 shows no binding affinity to pC vesicles (data not shown). The ITC data completely corroborate with the intrinsic tryptophan fluorescence data and clearly demonstrate that apoS100A13 exhibits preferential binding affinity to pS vesicles.
Fig. 3.
Isothermogram representing the binding of apoS100A13 to the SUVs of pS. The apparent binding constant (Kd app) of the protein-lipid interaction estimated from the high affinity phase is ~500 nM. The lower panel depicts the raw data of the µmol/sec of heat released at various molar ratio of the lipid to the protein. The raw data were fitted to a two site binding model. The titration was perfomed in 10 mM tris (pH 7.5) containing 100 mM NaCl. The concentration of protein used was 0.084 mM.
Lipid binding decreases the stability of apoS0013
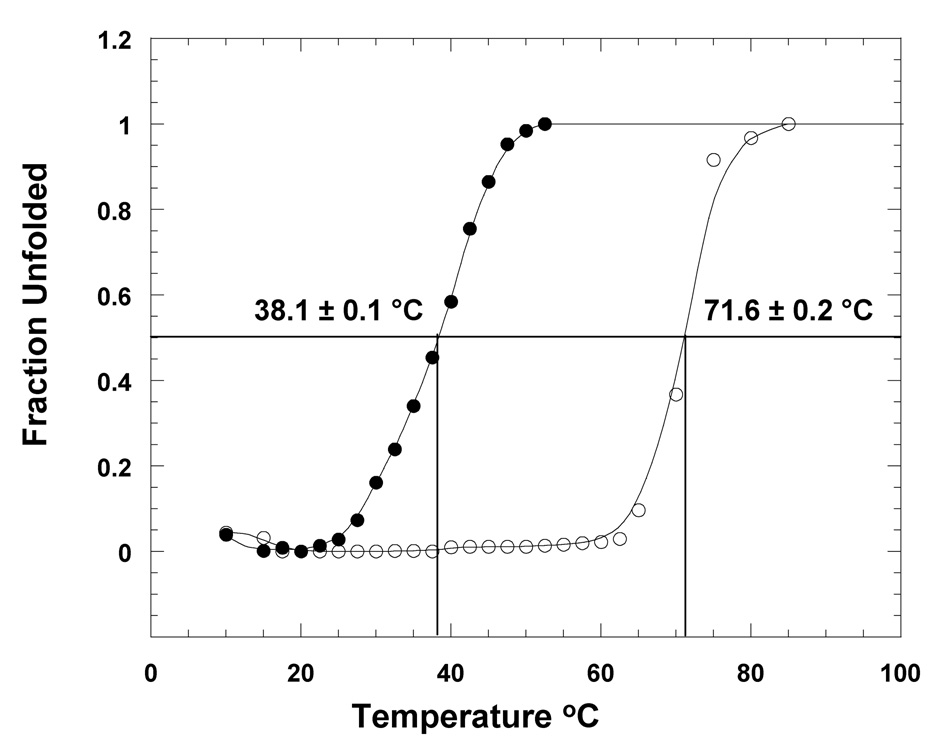
The effect(s) of lipid binding on the structural stability of apoS100A13 was assessed by equilibrium thermal denaturation monitored by changes in the intrinsic tryptophan fluorescence and also by limited trypsin digestion analyzed by SDS-PAGE. Equilibirum unfolding curve of apoS100A13 monitored by changes in the 320 nm emission shows the protein to be in its native state even up to 60 °C (Fig. 4). Beyond this temperature, the protein begins to unfold cooperatively and denatures completely at about 80 °C. The temperature for 50% of the protein molecules to be in the denatured state (Tm) is estimated to be 71.6 ± 0.2 °C. In marked contrast, apoS100A13 in the presence of pS unfolds completely at temperatures greater 50 °C (Fig. 4). The Tm for unfolding of apoS100A13 in the presence of pS vesicles is 38.1 ± 0.1 °C. These results unambiguously show that apoS100A13 destabilizes significantly on interaction with the small unilamelar vesicles of pS.
Fig. 4.
Thermal unfolding of apoS100A13 in the absence (open circle) and presence (closed circle) of pS. Thermal unfolding curves were monitored by changes in the intrinsic tryptophan fluorescence at 320 nm. The concentration of the protein used was 25 µg. mL−1. Protein samples were prepared in 10 mM tris (pH 7.5) containing 100 mM NaCl. Protein samples were excited at 280 nm.
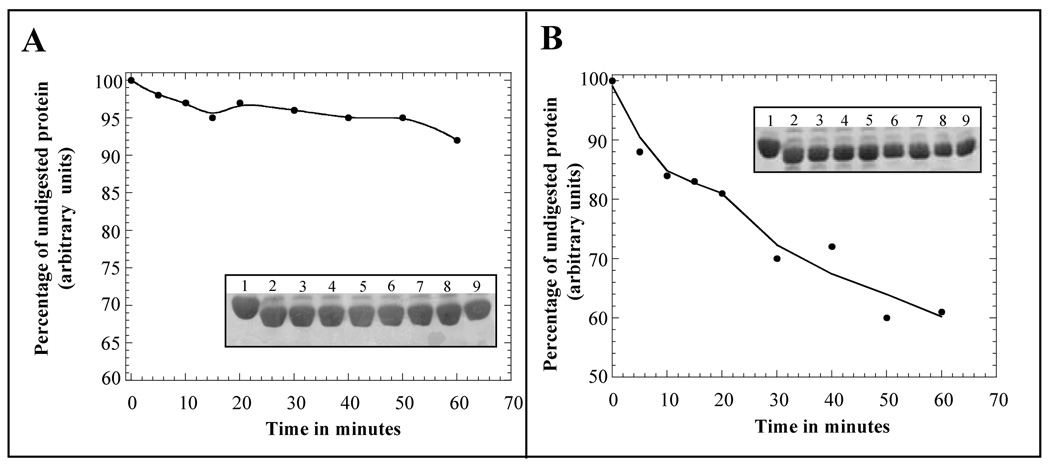
Limited proteolytic digestion is used routinely to investigate the conformational flexibility of proteins [34]. The proteolysis event is governed by the stereochemistry and accessibility of the protein substrate as well as the specificity of the proteolytic enzyme. Hence, even subtle conformational changes in the protein could be easily detected using the limited proteolytic digestion technique. S001A3 possesses 10 lysine and 6 arginine residues in its sequence and therefore it is an ideal substrate for trypsin cleavage. Undigested S100A13 yields a band corresponding to ~ 11 kDa on SDS-PAGE (Fig. 5). The intensity of this band (after Coomassie Blue staining) is used as a control to monitor the degree of action of trypsin on apoS100A13 in its free and the Ca2+ bound forms. Densitometric scans of the undigested S100A13 band (on the SDS-PAGE gels), obtained at various time periods of incubation of the protein with trypsin, shows that the protein is destabilized in the presence of pS. 92 % of the ~ 11 kDa S100A13 band remains intact in the absence of pS (Fig. 5, panel - A). However, in the presence of pS the protein is observed to be more susceptible to trypsin cleavage. Only 60 % of the S100A13 band remains undigested after 60 minutes of incubation of the protein with pS and the enzyme. Therefore, the results of the limited trypsin digestion experiments are in complete agreement of those obtained using the thermal denaturation experiments.
Fig. 5.
Limited trypsin digestion analysis of apoS100A13, in the absence (panel A) and presence (panel B) of pS monitored by SDS-PAGE. The curves represent the denisitometric scans of the S100A13 band (in the SDS-PAGE) at various times of incubation with trypsin. The inset figures show the intensity of the S100A13 band stained with Coomassie blue. The intensity of the S100A13 band not treated with trypsin is assumed as 100%. Proteolytic digesions were performed at an enzyme (trypsin) to substrate (S100A13) molar ratio of 1:1. Trypsin digestion was performed at 25 °C. Gels were destained in 45%:10%:45% methanol-acetic acid-water mixture for 12 hours. Lanes, 1–9, represent the trypsin digestion products after various time periods of incubation of apoS100A13 in the absence (Panel-A) and in the presence (Panel-B) of the pS vesicles. Lane-1, 0 min; lane-2, 5 min; lane-3, 10 min; lane-4, 15 min; lane-5, 20 min; lane-6, 30min; lane-7, 40 min; lane-8, 50 min; and lane-9, 60 min.
Conformational changes induced upon binding pS vesicles
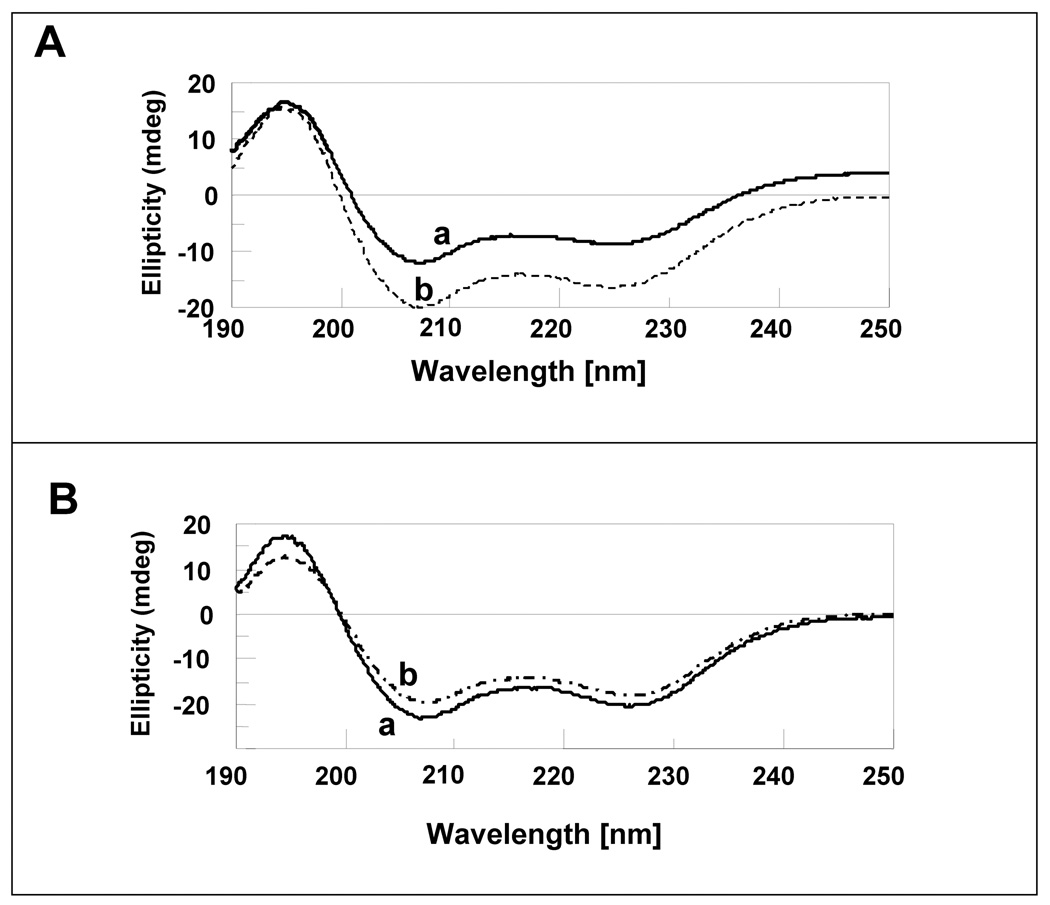
Far UV circular dichrosim (CD) is a popular technique to monitor secondary structural changes upon protein-protein or protein-ligand interactions. The far UV CD spectrum of apoS100A13 shows double minima centered at 208 nm and 222 nm, double minima reminiscent of alpha helical conformation (Fig. 6A, curve-a). The intensities of both the 208 nm and the 222 nm bands progressively increase with the increase in the ratio of pS to S100A13 (Fig. 6A, curve-b). These results suggest a moderate increase in the alpha helical conformation in apoS100A13 on binding to the pS vesicles. Interestingly, only small changes in the 208 nm and 222 nm ellipticity values are observed when calcium bound S00A13 is titrated with pS vesicles (Fig. 6B). The small change in the secondary structure observed for the calcium-bound S100A13 in the presence of pS vesicles is possibly suggestive of weak binding of the holoprotein to the lipid vescicles. These conclusions are consistent with those obtained based on the titration experiments monitored by changes in the intrinsic tryptophan fluorescence.
Fig. 6.
Far UV CD spectra of, apoS100A13 (Panel-A, curve-a) and apoS100A13 in the presence of pS (Panel-A, curve-b) and holoS100A13 in the presence of pS (Panel-B, curve-b, and 2 mM Ca2+ (Panel-B, curve-a). The concentration of S100A13 used was 100 uM. Far UV CD spectra were acquired at pS to S100A13 ratio of 10 to 1. All samples were prepared in 10 mM tris (pH 7.5) containing 100 mM NaCl at 25 °C. The spectra are an average of 5 scans. Necessary background corrections were made in all spectra.
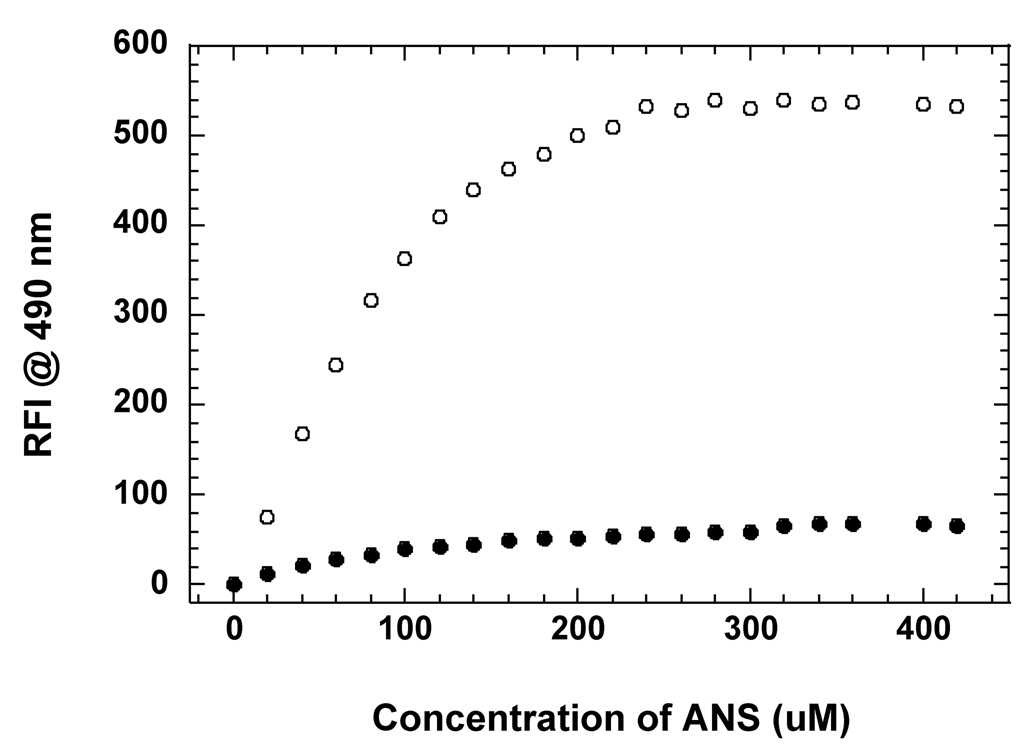
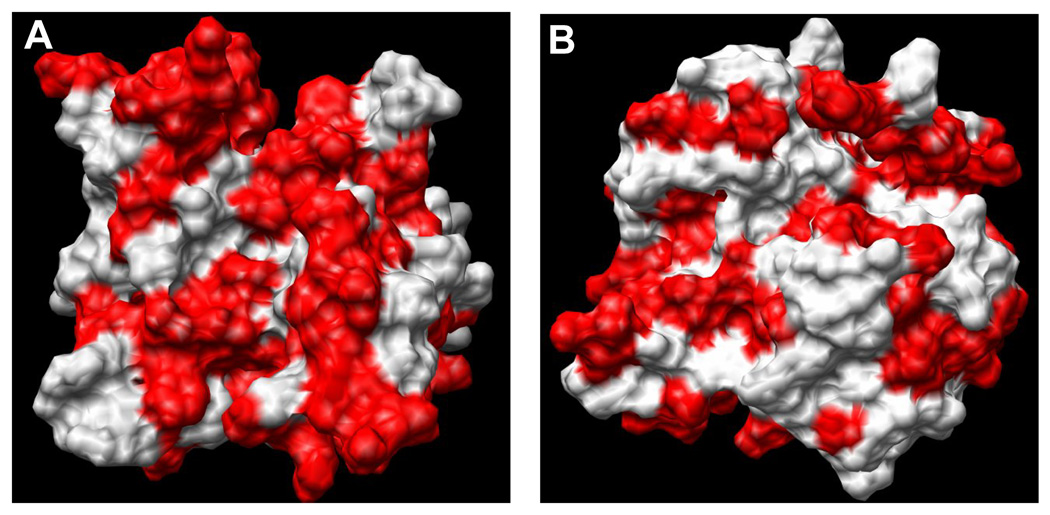
It is important to understand the structural basis for the differences in affinities of the apoS001A3 and holoS100A13 to bind to pS vesicles. S100A13 is a unique member of the S100 protein family and exhibits several properties that are different from a typical member belonging to the S100 family of proteins [35]. In general, S100 proteins exhibit a positive cooperativity for the four calcium binding sites present in the dimeric structure. The structural changes induced due to calcium binding is best explained by a “change in hand” mechanism [28]. Binding of Ca2+ causes a significant change in the interhelical angle between the helices H3/H4’ and H4/H4’ that flank the canonical Ca2+ binding loop located in the C-terminal EF-hand motif. The change in the interhelical angle (upon Ca2+ binding) exposes a non-polar hydrophobic surface between the C-terminal helices [28, 29]. The exposure of hydrophobic surface on Ca2+ binding is common to all the members of the S100 protein. In fact, S100 proteins recognize and bind to their target proteins/ligands through interactions involving residues in the solvent-exposed hydrophobic surface in the Ca2+ bound state. In sharp contrast, the opposite structural effects are observed in S100A13. ANS (8-anilino-1-napthalene sulfonate), a hydrophobic dye that is popularly used to detect solvent-accessible non-polar surfaces in proteins, binds strongly to apoS100A13 and exhibits a strong fluorescence signal at 490 nm (Fig. 7). Titration of apoS100A13 with increasing concentrations of ANS shows a progressive increase in the emission intensity at 490 nm (Fig. 7). The ANS binding effect saturates beyond a ANS concentration of 250 µM. Interestingly, Ca2+-bound S10013 shows very weak binding affinity to ANS (Fig. 7). These results suggest that unlike other S100 proteins, apoS100A13 has large areas of solvent accessible non-polar surface(s) which get buried in the interior of the protein upon binding to Ca2+. Comparison of the three-dimensional structures of S100A13 in its free and the Ca2+-bound states shows a hydrophobic surface consisting of loop-II is solvent exposed in apoS100A13 (Fig. 8A). Interestingly, these residues are buried in Ca2+ -bound state (Fig. 8B). It appears that the solvent exposed non-polar surface provide the binding sites for pS. The burial of the hydrophobic surface(s) in the protein upon binding to Ca2+ explains the weak binding affinity of Ca2+-bound S100A13 to pS.
Fig. 7.
Binding affinity of ANS to apoS110A13 in the absence (open circle) and in the presence (closed circle) of Ca2+. The concentration of the protein was 25 µg mL−1. The concentration of Ca2+ used was 2mM. The excitation wavelength used for the ANS binding experiments was 390 nm. Appropriate background corrections were made in all spectra.
Fig. 8.
MolMol representation of the hydrophobic surface (shown in red) in the structure of S100A13 in the absence (Panel-A, PDB ID-1YUR) and presence (Panel-B, PDB ID-1YUT) of calcium. The non-polar surface decreases significantly in the presence of calcium.
S100A13-lipid interactions monitored by NMR spectroscopy
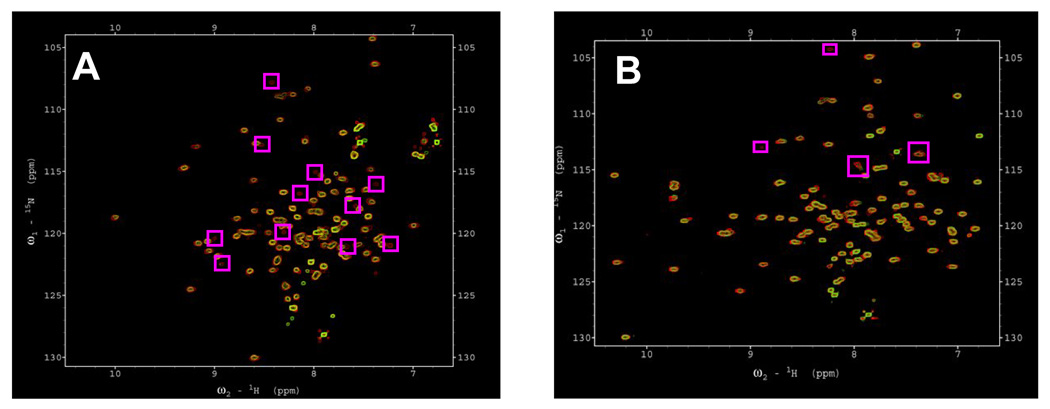
1H-15N HSQC spectrum is the finger-print of the backbone conformation of a protein (2). Each crosspeak in the spectrum represents the backbone amide of an amino acid in a protein. Therefore, once all the crosspeaks in the 1H-15N HSQC are assigned, it would be straightforward to map the protein-protein or protein-ligand interface by monitoring the chemical shift perturbation or the disappearance of the 1H-15N crosspeaks in the spectrum. The 1H-15N HSQC spectrum of apoS100A13 at pH 7.5 is reasonably well dispersed but there are severe overlap of many crosspeaks located between 7.6 ppm to 9 ppm, suggesting that portions of the apoS100A13 molecule are unstructured (Fig. 9). In comparison, most of the crosspeaks in the 1H-15N HSQC spectrum of Ca2+-S100A13 bound are well spread-out and very few crosspeaks in the spectrum are overlapped (Fig. 9). The increased dispersion observed in the 1H-15N HSQC spectrum of Ca2+-S100A13 is consistent with the formation of a beta-sheet type of structure at the calcium binding site [30]. 1H-15N HSQC spectrum of apoS100A13 obtained in the presence of pS (at pS to apoS100A13 ratio of 5:1) shows that about 10 of the crosspeaks originally observed in the spectrum of apoS100A13 in the free state are missing (Fig. 9A). The disappeared crosspeaks possibly represent the amino acids residues in apoS100A13 involved in interaction with vesicles of pS. However, lack of resonance assignments in apoS100A13 at pH 7.5, precludes the identification of the residues involved in the apoS100A13-pS interaction. 1H-15N HSQC spectrum of Ca2+-S100A13 shows the disappearance of only four crosspeaks (of G31, L49, S74 and K85) in the presence of pS (Fig. 9B). These residues are located in close spatial proximity to the Ca2+-binding EF hand motifs. Relatively lesser number of pS interaction sites in Ca2+-S100A13 are consistent with the results of the steady state fluorescence experiments. The results discussed so far appear to suggest that Ca2+ - binding triggers a conformational switch that converts S100A13 from a membrane-binding form to a conformation that has no or lesser binding affinity to membrane lipids. In this context, it will be interesting to investigate the Ca2+ - binding affinity of S100A13 in its free state and when present in the FGF-1 multiprotein release complex.
Fig. 9.
1H-15N HSQC spectra of S100A13, in the absence of pS (panel A, red); at pS to S001A13 ratio of 1: 5 (panel A, green); in the presence 2 mM Ca2+ (panel B, red) at pS to S001A13 ratio of -1: 5 (panel B, green). The boxed areas in the spectra represent crosspeaks that either shift or disappear in the presence of pS. The concentration of S100A13 used was 0.1 mM. Protein samples were prepared in 90% H2O + 10% D2O contaning 10 mM tris-d11 and 100 mM NaCl (pH 7.5).
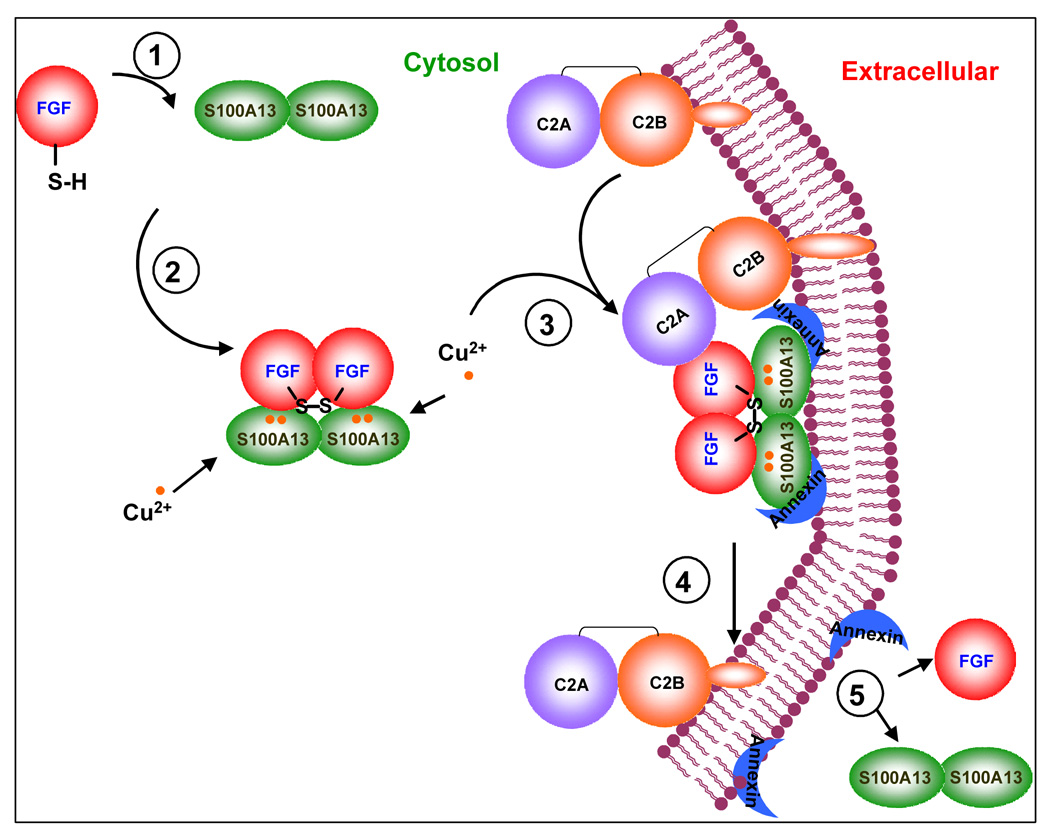
Based on the results described thus far, we are tempted to suggest a model predicting the sequence of molecular events involved in the release of FGF-1 to the extracellular compartment (Fig. 10). The first step involves the binding of FGF-1 to S100A13 (Fig. 10). As S100A13 is symmetrical dimer, two molecules of FGF-1 possibly interact with S100A13 to form a 2:1 FGF-1/S100A13 complex. However, it is not clear if S100A13 interacts with FGF-1 in its apo-form or in the Ca2+ bound form. Binding of Cu2+ to apo/holoS100A13 appears to be the second step. Sivaraja et al., recently demonstrated that Cu2+ can bind to both apoS100A13 as well as to the Ca2+-bound S100A13 [25]. Binding of Cu2+ and calcium is not mutually exclusive. The Cu2+ bound to S100A13 plausibly oxidizes the thiol group of Cys30 to form an intermolecular disulfide bond linking two FGF-1 molecules (Fig. 10). Subsequently the FGF-1/S00A13 binary complex interacts with the C2A domain of synaptotagmin which is a part of p40 Syt1 form. At least four lines of evidence support the formation of the multiprotein release complex consisting of FGF-1/S100A13/p40Syt1. 1. Identification of a multiprotein complex containing FGF-1, S100A13 and p40 Syt1 by HPLC analysis of the brain extracts containing FGF-1 [10]; 2. Colocalization of FGF-1, S100A13 and Syt1 near the cell membrane, detected using confocal microscopy [23]; 3. Association of FGF-1 with S100A13 and p40 Syt1 in the medium conditioned by heat shocked cotransfectrant cells [36, 37]; 4. Copper-induced formation of high molecular weight complexes containing recombinant FGF-1, S100A13 and p40 Syt1 [11]. Interaction of the FGF-1/S100A13 with p40Syt1 possibly occurs through a direct binding between FGF-1 and the C2A domain of p40Syt1. This proposal is supported by our preliminary ITC data which indicate that the binding affinity of FGF-1 to the C2A domain of p40 Syt1 is in the micromolar range (data not shown). Similar studies involving S100A13 and the C2A domain (of p40Syt1) showed no binding between these proteins. Results of this study indicate that the binding affinity of apoS100A13 plausibly aids in the anchoring of the multiprotein FGF-1 release complex to the cell membrane. It should be mentioned that in a recent study we observed that both FGF-1 and the C2A domain also exhibit significant lipid binding affinity [38]. Therefore, it appears that all the three protein components of the FGF-1 release complex (FGF-1, S100A13 and Syt1) play important roles in the translocation of FGF-1 across the cell membrane. In addition, S100A13 also appears to provide binding interface for the interaction of the multiprotein release complex with membrane bound annexin [6]. There are several reports of members of S100 protein family interacting with those belonging to the annexin family [39]. Annexin II is known to exist on the inner and outer sides of the plasma membrane [6, 40]. Annexins are reported to “flip-flop” between the inner and outer sides of the cell membrane after thrombin treatment and under stress conditions [41]. Therefore, it is possible that the “flip-flopping” property of annexin facilitates the export of FGF-1 into the extracellular compartment. However, it is still not clear if FGF-1 alone or the whole multoprotein FGF-1 release complex is exported into the extracellular medium. In the absence of sufficient experimental evidence, the mechanism proposed for the non-classical secretion of FGF-1 should be considered as a working model. More detailed studies need to be conducted to validate many portions of the proposed model.
Fig. 10.
Cartoon representing the possible sequence of molecular events involved in the non-classical export of FGF-1. The first step appears to be the formation of the FGF-1/S100A13 binary complex. In the second step, copper (Cu2+) binds to both S100A13 and the C2A domain of Syt1. The protein bound Cu2+ possibly specifically oxidizes the thiol group of Cys30 (in FGF-1) resulting in the formation of the homodimer of S100A13. The FGF-1/S100A13 complex appears to subsequently interact with the C2A domain of p40Syt1 to form a multiprotein complex. S100A13 may anchor the multiprotein complex by providing the necessary interactions with both the phospholipids and as well as the membrane bound annexin molecules. FGF-1 is plausibly transported to the extracellular compartment through the “flip-flop” action of annexins.
Acknowledgement
This work was supported by grants from the National Institute for Health (NIH NCRR COBRE Grant 1 P20RR15569), the Department of Energy (DE-FGF02-01ER15161) and the Arkansas Biosciences Institute to TKSK. IP was supported by NIH grants HL32348, HL35627 and RR15555 (project 4).
Footnotes
Publisher's Disclaimer: This is a PDF file of an unedited manuscript that has been accepted for publication. As a service to our customers we are providing this early version of the manuscript. The manuscript will undergo copyediting, typesetting, and review of the resulting proof before it is published in its final citable form. Please note that during the production process errors may be discovered which could affect the content, and all legal disclaimers that apply to the journal pertain.
References
- 1.Angulo J, Ojeda R, de Paz JL, Lucas R, Nieto PM, Lozano RM, Redondo-Horcajo M, Gimenez-Gallego G, Martin-Lomas M. The activation of fibroblast growth factors (FGFs) by glycosaminoglycans: Influence of the sulfation pattern on the biological activity of FGF-1. ChemBioChem. 2004;5:55–61. doi: 10.1002/cbic.200300696. [DOI] [PubMed] [Google Scholar]
- 2.Arunkumar AI, Srisailam S, Kumar TKS, Kathir KM, Chi YH, Wang HM, Chang GG, Chiu I, Yu C. Structure and stability of an acidic fibroblast growth factor from Notophthalmus viridescens. J. Biol. Chem. 2002;277:46424–46432. doi: 10.1074/jbc.M207814200. [DOI] [PubMed] [Google Scholar]
- 3.Ornitz DM, Itoh N. Fibroblast growth factors. Genome Biol. 2001;2(3) doi: 10.1186/gb-2001-2-3-reviews3005. REVIEWS3005. [DOI] [PMC free article] [PubMed] [Google Scholar]
- 4.Plotnikov AN, Schlessinger J, Hubbard SR, Mohammadi M. Structural basis for FGF receptor dimerization and activation. Cell. 1999;98:641–650. doi: 10.1016/s0092-8674(00)80051-3. [DOI] [PubMed] [Google Scholar]
- 5.Hung KW, Kumar TKS, Kathir KM, Xu P, Ni F, Ji HH, Chen MC, Yang CC, Lin FP, Chiu IM, Yu C. Solution structure of the ligand binding domain of the fibroblast growth factor receptor: role of heparin in the activation of the receptor. Biochemistry. 2005;44 doi: 10.1021/bi051030n. 15787-1598. [DOI] [PubMed] [Google Scholar]
- 6.Prudovsky I, Mandinova A, Soldi R, Bagala C, Graziani I, Landriscina M, Tarantini F, Duarte M, Bellum S, Doherty H, Maciag T. The non-classical export routes: FGF1 and IL-1alpha point the way. J. Cell Sci. 2003;116:4871–4881. doi: 10.1242/jcs.00872. [DOI] [PubMed] [Google Scholar]
- 7.Landriscina M, Bagala C, Mandinova A, Soldi R, Micucci I, Bellum S, Prudovsky I, Maciag T. Copper induces the assembly of a multiprotein aggregate implicated in the release of fibroblast growth factor 1 in response to stress. J. Biol. Chem. 2001;276:25549–25557. doi: 10.1074/jbc.M102925200. [DOI] [PubMed] [Google Scholar]
- 8.Tarantini F, Micucci I, Bellum S, Landriscina M, Garfinkel S, Prudovsky I, Maciag T. The precursor but not the mature form of IL1alpha blocks the release of FGF1 in response to heat shock. J. Biol. Chem. 2001;276:5147–5151. doi: 10.1074/jbc.C000714200. [DOI] [PubMed] [Google Scholar]
- 9.Friesel R, Maciag T. Fibroblast growth factor prototype release and fibroblast growth factor receptor signaling. Thromb. Haemost. 1999;82:748–754. [PubMed] [Google Scholar]
- 10.Mouta Carreira C, Landriscina M, Bellum S, Prudovsky I, Maciag T. The comparative release of FGF1 by hypoxia and temperature stress. Growth Factors. 2001;18:277–285. doi: 10.3109/08977190109029116. [DOI] [PubMed] [Google Scholar]
- 11.Landriscina M, Prudovsky I, Mouta Carreira C, Soldi R, Tarantini F, Maciag T. Amlexanox reversibly inhibits cell migration and proliferation and induces the Src-dependent disassembly of actin stress fibers in vitro. J. Biol. Chem. 2000;275:32753–32762. doi: 10.1074/jbc.M002336200. [DOI] [PubMed] [Google Scholar]
- 12.LaVallee TM, Tarantini F, Gamble S, Mouta Carreira C, Jackson A, Maciag T. Synaptotagmin-1 is required for fibroblast growth factor-1 release. J. Biol. Chem. 1998;273:22217–22223. doi: 10.1074/jbc.273.35.22217. [DOI] [PubMed] [Google Scholar]
- 13.Tarantini F, Gamble S, Jackson A, Maciag T. The cysteine residue responsible for the release of fibroblast growth factor-1 residues in a domain independent of the domain for phosphatidylserine binding. J. Biol. Chem. 1995;270:29039–29042. doi: 10.1074/jbc.270.49.29039. [DOI] [PubMed] [Google Scholar]
- 14.Rescher U, Gerke V. Annexins–unique membrane binding proteins with diverse functions. J. Cell Sci. 2004;117:2631–2639. doi: 10.1242/jcs.01245. [DOI] [PubMed] [Google Scholar]
- 15.Jackson MR, Song ES, Yang Y, Peterson PA. Empty and peptide-containing conformers of class I major histocompatibility complex molecules expressed in Drosophila melanogaster cells. Proc Natl Acad Sci U S A. 1992;89:12117–12121. doi: 10.1073/pnas.89.24.12117. [DOI] [PMC free article] [PubMed] [Google Scholar]
- 16.Andrei C, Dazzi C, Lotti L, Torrisi MR, Chimini G, Rubartelli A. The secretory route of the leaderless protein interleukin 1β involves exocytosis of endolysosome-related vesicles. Mol. Biol. Cell. 1999;10:1463–1467. doi: 10.1091/mbc.10.5.1463. [DOI] [PMC free article] [PubMed] [Google Scholar]
- 17.Rubartelli A, Cozzolino F, Talio M, Sitia R. A novel secretory pathway of interleukin 1beta, a protein lacking a signal sequence. EMBO J. 1990;9:1503–1510. doi: 10.1002/j.1460-2075.1990.tb08268.x. [DOI] [PMC free article] [PubMed] [Google Scholar]
- 18.Engleka KA, Maciag T. Inactivation of human fibroblast growth factor-1 (FGF-1) activity by interaction with copper ions involves FGF-1 dimer formation induced by copper-catalyzed oxidation. J Biol Chem. 1992;267(16):11307–11315. [PubMed] [Google Scholar]
- 19.Jackson A, Tarantini F, Gamble S, Friedman S, Maciag T. The release of fibroblast growth factor-1 from NIH 3T3 cells in response to temperature involves the function of cysteine residues. J. Biol. Chem. 1995;270:33–36. doi: 10.1074/jbc.270.1.33. [DOI] [PubMed] [Google Scholar]
- 20.Bai J, Chapman ER. The C2 domains of synaptotagmin-partners in exocytosis. Trends Biochem. Sci. 2004;29:143–151. doi: 10.1016/j.tibs.2004.01.008. [DOI] [PubMed] [Google Scholar]
- 21.Rajalingam D, Kumar TK, Soldi R, Graziani I, Prudovsky I, Yu C. Molecular mechanism of inhibition of nonclassical FGF-1 export. Biochemistry. 2005;44:15472–15479. doi: 10.1021/bi0516071. [DOI] [PubMed] [Google Scholar]
- 22.Rajalingam D, Kumar TK, Yu C. The C2A domain of synaptotagmin exhibits a high binding affinity for copper: implications in the formation of the multiprotein FGF release complex. Biochemistry. 2005;44:14431–14442. doi: 10.1021/bi051387r. [DOI] [PubMed] [Google Scholar]
- 23.Prudovsky I, Bagala C, Tarantini F, Mandinova A, Soldi R, Bellum S, Maciag T. The intracellular translocation of the components of the fibroblast growth Factor-1 release complex precedes their assembly prior to export. J. Cell Biol. 2002;158:201–208. doi: 10.1083/jcb.200203084. [DOI] [PMC free article] [PubMed] [Google Scholar]
- 24.Mouta Carreira C, LaVallee TM, Tarantini F, Jackson A, Lathrop JT, Hampton B, Burgess WH, Maciag T. S100A13 is involved in the regulation of fibroblast growth factor-1 and p40 synaptotagmin-1 release in vitro. J. Biol. Chem. 1998;273:22224–22231. doi: 10.1074/jbc.273.35.22224. [DOI] [PubMed] [Google Scholar]
- 25.Sivaraja V, Kumar TK, Rajalingam D, Graziani I, Prudovsky I, Yu C. Copper binding affinity of S100A13, a key component of the FGF-1 nonclassical copper-dependent release complex. Biophys. J. 2006;91:1832–1843. doi: 10.1529/biophysj.105.079988. [DOI] [PMC free article] [PubMed] [Google Scholar]
- 26.Nacken W, Sorg C, Kerkhoff C. The myeloid expressed EF-hand proteins display a diverse pattern of lipid raft association. FEBS. Lett. 2004;572:289–293. doi: 10.1016/j.febslet.2004.07.024. [DOI] [PubMed] [Google Scholar]
- 27.Graziani I, Bagala C, Duarte M, Soldi R, Kolev V, Tarantini F, Kumar TK, Doyle A, Neivandt D, Yu C, Maciag T, Prudovsky I. Release of FGF1 and p40 synaptotagmin 1 correlates with their membrane destabilizing ability. Biochem. Biophys Res Commun. 2006;349:192–199. doi: 10.1016/j.bbrc.2006.08.021. [DOI] [PMC free article] [PubMed] [Google Scholar]
- 28.Smith SR, Shaw GS. A change in hand mechanism for S100 proteins. Biochem. Cell Biol. 1998;76:324–333. doi: 10.1139/bcb-76-2-3-324. [DOI] [PubMed] [Google Scholar]
- 29.Bhattacharya S, Bunick CG, Chazin WJ. Target Selectivity of EF-Hand proteins. Biochim. Biophys. Acta. 2004;1742:69–79. doi: 10.1016/j.bbamcr.2004.09.002. [DOI] [PubMed] [Google Scholar]
- 30.Sivaraja V, Kumar TK, Prudovsky I, Yu C. Three-dimensional solution structure of a unique S100 protein. Biochem. Biophys. Res. Commun. 2005;335:1140–1148. doi: 10.1016/j.bbrc.2005.08.005. [DOI] [PubMed] [Google Scholar]
- 31.Li M, Zhang PF, Pan XW, Chang WR. Crystal structure study on human S100A13 at 2.0 A resolution. Biochem. Biophys. Res. Commun. 2007;356:616–621. doi: 10.1016/j.bbrc.2007.03.014. [DOI] [PubMed] [Google Scholar]
- 32.Arnesano F, Banci L, Bertini I, Fantoni A, Tenori L, Viezzoli MS. Structural interplay between calcium(II) and copper(II) binding to S100A13 protein. Angew Chem Int.Ed Engl. 2005;44:6341–6344. doi: 10.1002/anie.200500540. [DOI] [PubMed] [Google Scholar]
- 33.Banerjee M, Poddar A, Mitra G, Surolia A, Owa T, Battacharyya B. S Sulfonamide drugs binding to the colchicine site of tubulin: Thermodynamic analysis of the drug-tubulin interactions by isothermal titration calorimetry. J. Med. Chem. 2005;48:547–555. doi: 10.1021/jm0494974. [DOI] [PubMed] [Google Scholar]
- 34.Wang L, L, Kallenbach NR. Proteolysis as a measure of the free energy difference between cytochrome c and its derivatives. Protein Sci. 1998;7:2360–2464. doi: 10.1002/pro.5560071124. [DOI] [PMC free article] [PubMed] [Google Scholar]
- 35.Heizmann CW, Fritz F, Schafer BW. S100 proteins, functions and pathology. Front. Biosci. 2002;7:1356–1368. doi: 10.2741/A846. [DOI] [PubMed] [Google Scholar]
- 36.Landriscina M, Soldi R, Bagala C, Micucci I, Bellum S, Tarantini F, Prudovsky I, Maciag T. S100A13 participates in the release of fibroblast growth factor 1 in response to heat shock in vitro. J Biol Chem. 276:22544–22552. doi: 10.1074/jbc.M100546200. [DOI] [PubMed] [Google Scholar]
- 37.Truanting F, LaVallee T, Jackson A, Gamble S, Mouta Carreira C, Garfinkel S, Burgess WH, Maciag T. The extravesicular domain of synaptotagmin-1 is released with the latent fibroblast growth factor-1 homodimer in response to heat shock. J Biol Chem. 1998;273:22209–22216. doi: 10.1074/jbc.273.35.22209. [DOI] [PubMed] [Google Scholar]
- 38.Rajalingam D, Graziani I, Prudovsky I, Yu C, Kumar TKS. Acidic Fibroblast growth factor and the C2A domain of synaptotagmin exist as partially structured states under acidic conditions – Relevance in the non-classical secretion of the fibroblast growth factor. Biochemistry. 2007;46:9225–9238. doi: 10.1021/bi7002586. [DOI] [PMC free article] [PubMed] [Google Scholar]
- 39.Santamaria-Kisiel L, Rintala-Dempsey AC, Shaw GS. Calcium-dependent and – independent interactions of the S100 protein family. Biochem. J. 2006;396:201–214. doi: 10.1042/BJ20060195. [DOI] [PMC free article] [PubMed] [Google Scholar]
- 40.Hajjar KA, Jacovina AT, Chacko j. An endothelial cell receptor for plasminogen/tissue plasminogen activator. 1. Identity with annexin II. J. Biol. Chem. 1994;269:21191–21197. [PubMed] [Google Scholar]
- 41.Deora AB, Kreitzer G, Jacovina AT, Hajjar KA. An annexin 2 phosphorylation switch mediates p11-dependent translocation of annexin 2 to the cell surface. J Biol Chem. 2004;279:43411–43418. doi: 10.1074/jbc.M408078200. [DOI] [PubMed] [Google Scholar]


