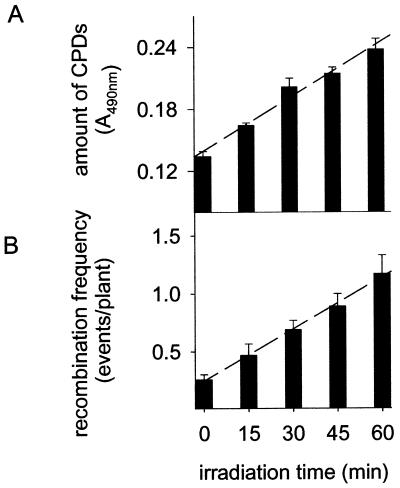
Figure 2.
Dependence of CPD amounts and recombination frequencies on UV-B irradiation times. Plants were exposed to UV-B (described in Fig. 1A, WG 295) for various time intervals. Amounts of CPDs (A) and recombination frequency (B). Error bars represent the SE.

