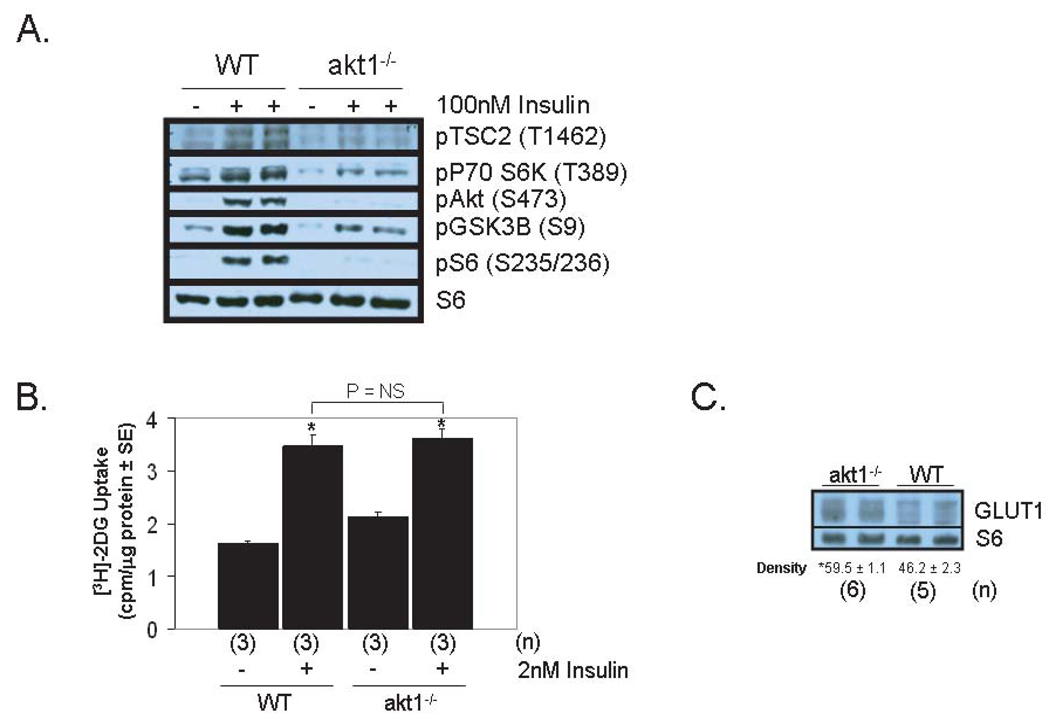
Figure 2.
Akt1 is not required for normal cardiac glucose uptake. A. Analysis of the insulin-stimulated Akt signaling pathway in WT and akt1−/− AMCMs. Serum-deprived AMCMs were stimulated with vehicle or with 100nM insulin for 5 minutes. Lysates were analyzed by immunoblotting with primary antibodies that specifically recognize the phosphorylated forms of Akt1-3 (S473 of Akt1), TSC2 (T1462), GSK3β (S9), p70 S6K (T389) and S6 (S235/236). Total S6 was probed to control for protein loading. B. Preserved insulin-stimulated glucose uptake in akt1−/− AMCMs. Serum-deprived AMCMs from 8-week-old WT and akt1−/− mice were treated with vehicle or with 2 nM insulin in the presence of [3H]-2DG for 5 minutes. Mean 2DG uptake (cpm per µg protein) ± SE is graphed. 2DG uptake in parallel cultures pre-incubated with 10µM cytochalasin B was uniformly subtracted from experimental groups to control for non-specific 2DG transport. Two-tailed, two-sample t-tests were performed to compare: WT control vs. WT stimulated, akt1−/− control vs. akt1−/− stimulated, WT stimulated vs. akt1−/− stimulated. *, P < 0.05 versus congemc control group (t-test with Bonferroni post-hoc correction, 3 hypotheses) C. GLUT1 protein levels are increased in akt1−/− cardiomyocytes. Protein lysates from WT and akt1−/− AMCMs were analyzed by anti-GLUT1 immunoblotting. Blots were also probed for S6 levels to control for protein loading. Below each pair of bands is the mean normalized band density ± SE for each group. The number of animals analyzed (n) for each genotype are indicated. *, P < 0.05 versus mean WT GLUT1 band density (two-tailed, homoscedastic t-test).

