
Figure 8.
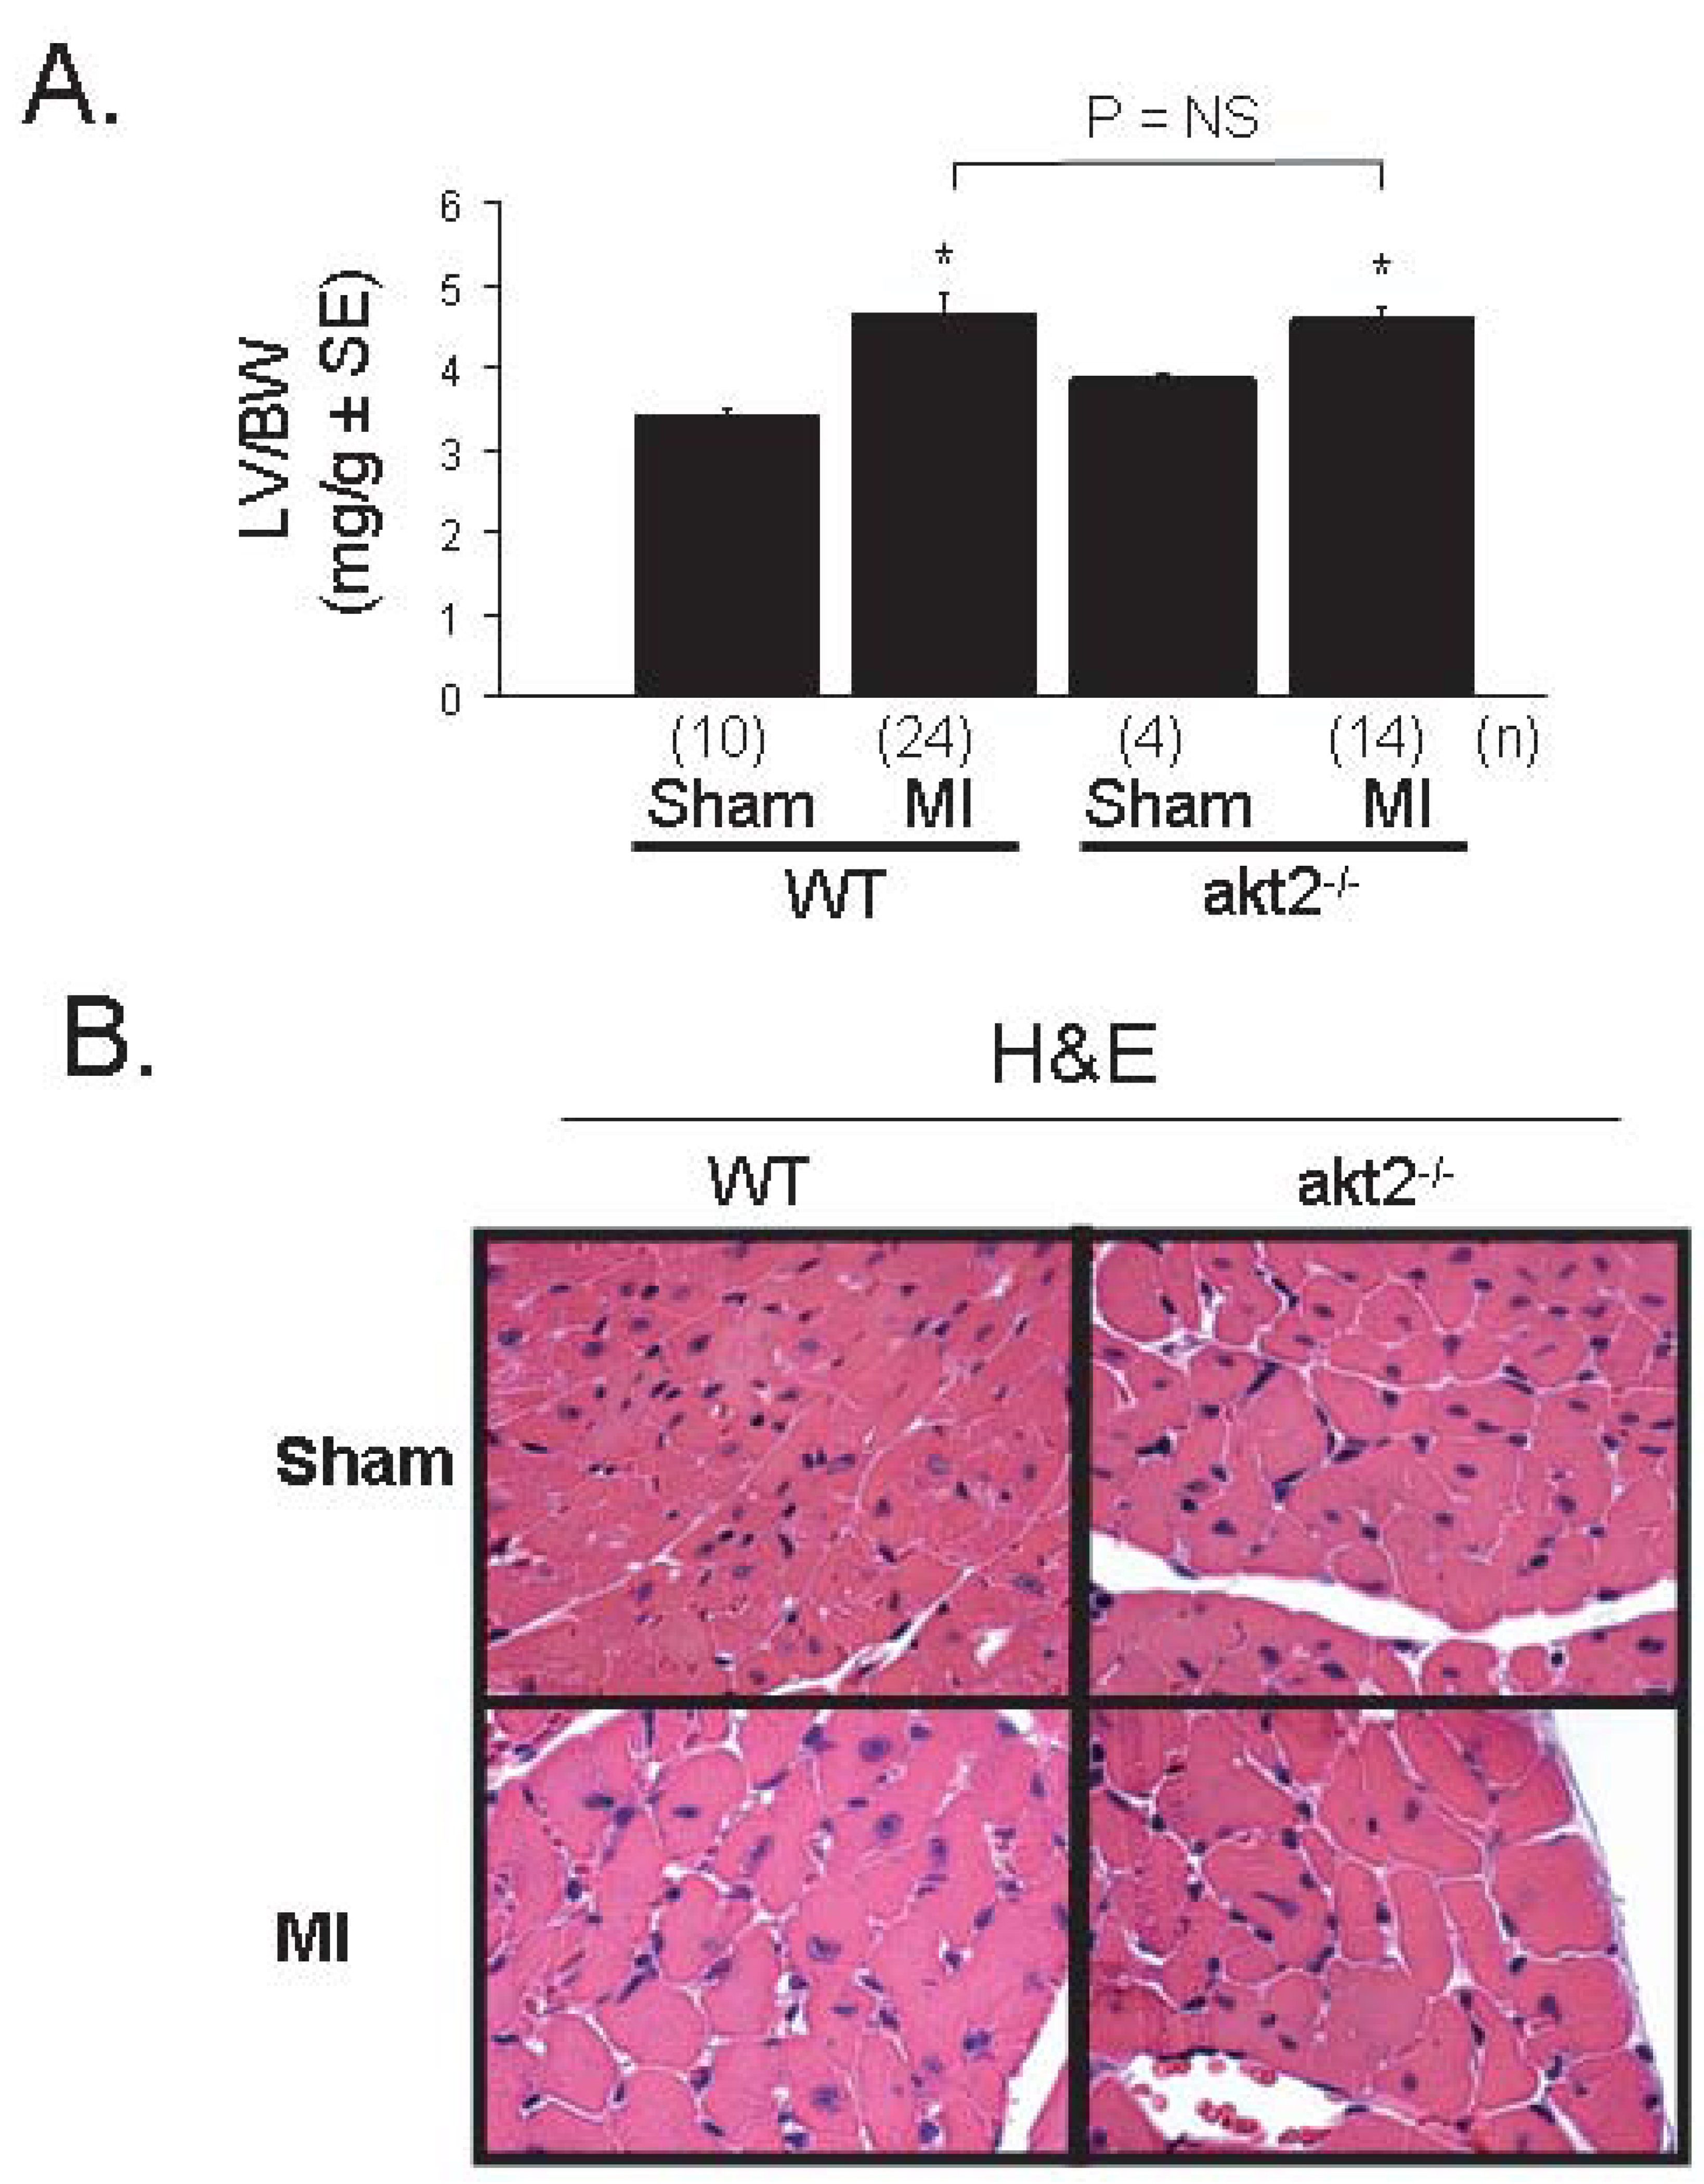


Cardiac hypertrophy is normal—but cardiomyocyte apoptosis is increased—after myocardial infarction in akt2−/− mice. A. Morphometric analysis of dissected LVs from WT and akt2−/− mice obtained 7 days after MI or sham operation. Graphed are the mean LV weight-to-body weight ratios for each group. Numbers of mice analyzed in each group (n) are indicated below each bar. The following t-tests were performed with Bonferroni post-hoc correction (3 hypotheses): WT sham versus WT MI, akt2−/− sham vs. akt2−/− MI, WT MI vs. akt2−/− MI. *, P < 0.05 versus congenic control. B. High-powered photomicrographic analysis of myocyte cross-sectional area in hematoxylin & eosin-stained transverse sections of ventricular myocardium distant from the infarct zone obtained from WT and akt2−/− mice subjected to MI or sham operation 7 days earlier. C. Computerized cardiomyocyte cross-sectional area quantification in heart sections described in (B). Graphed are the mean cardiomyocyte cross-sectional areas ± SE. Quantifications represent cardiomyocyte tracings of all cells in 3–5 distinct, random high-powered fields per animal, obtained from 3–5 different animals in each treatment group. D. Low-power photomicrographic analysis of cardiomyocyte apoptosis by TUNEL in the peri-infarct zone (defined as the one-quarter circumference of the LV on either side of the infarct) of ventricular tissue sections from WT and akt2−/− mice obtained 7 days after MI or sham operation. Arrows indicate TUNEL-positive staining. E. Quantification of TUNEL positivity in photomicrographs represented in (D). Graphed is the mean TUNEL-positive nuclei observed in each high-power field per 105 nuclei). The following t-tests were performed with Bonferroni post-hoc correction (2 hypotheses): WT sham versus akt2−/− sham; WT MI vs. akt2−/− MI. F. Representative photomicrographs of Masson’s trichrome-stained transverse LV sections derived from WT and akt2−/− mice 7 days after left coronary artery ligation. G. Quantitative analysis of infarct areas from photomicrographs represented in (F). % infarct area was calculated as (trichrome positive area) / (total LV tissue area). The numbers of mice analyzed in each group (n) are shown below each bar. 3–6 distinct LV sections were scored per animal. Graphed is the mean % infarct area ± SE observed in each animal. H. Enhanced apoptosis in akt2−/− AMCMs subjected to oxidative stress. Serum-deprived WT and akt2−/− AMCMs were incubated in the presence or absence of 25µM H2O2 for 16hrs and apoptosis was colorimetrically evaluated by the Cell Death Detection Apoptosis ELISA Assay kit (Roche Biochemicals) according to manufacturer specifications. Graphed is the mean optical density at 405nm (OD405) normalized to sample protein concentration (OD595) determined by the Bradford Reagent method ± SE, expressed as fold over control. The number of samples evaluated (n) under each treatment condition is displayed below each bar. P < 0.005 in H2O2-treated WT versus H2O2-treated akt2−/− AMCMs.