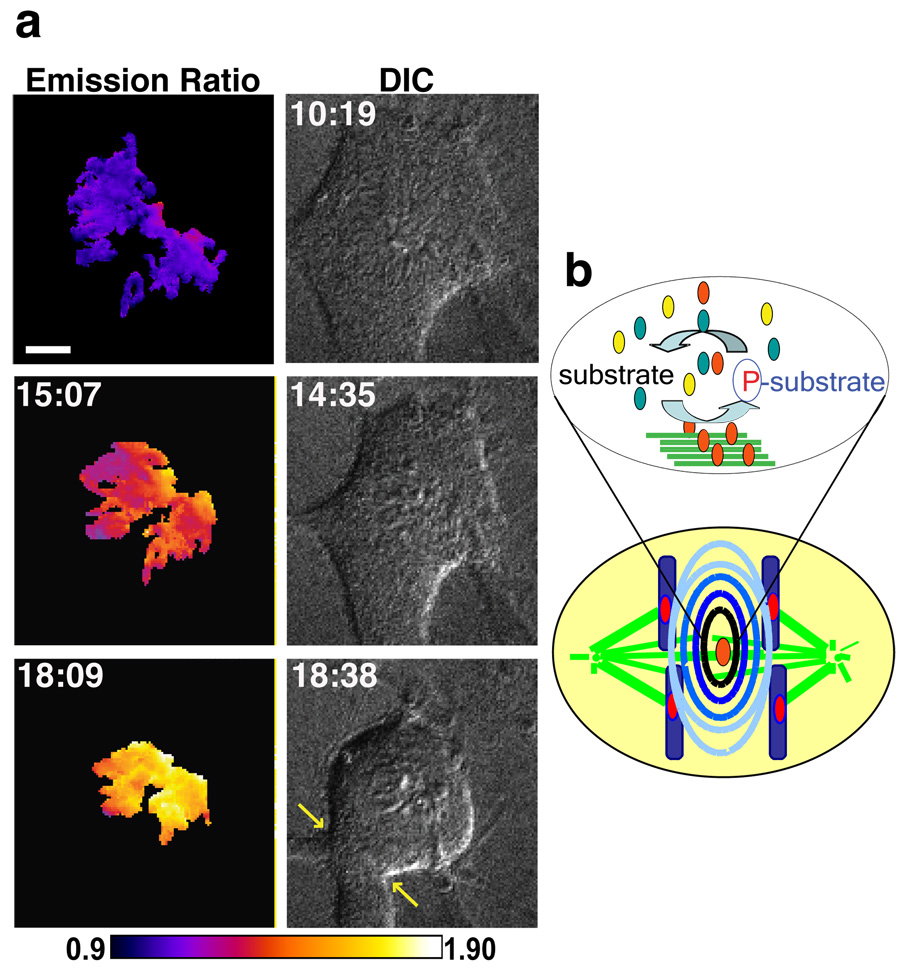
Figure 4. The phosphorylation gradient in a monopolar anaphase predicts the cleavage site.
a–d, Cells expressing either the chromatin-targeted sensor (a–b) or Aurora B-GFP (c–d) were depleted of Mad2 by RNAi and imaged through anaphase in the presence of the kinesin-5 inhibitor monastrol. Unprocessed YFP images (a) show chromosome movement relative to the cell perimeter (outlined in white), and color coded images show the YFP/CFP emission ratio (b). Aurora B-GFP (c) redistributes to the cortex, with chromosomes and cleavage furrow visualized by DIC (d). Timestamps min:sec. Scale bar 5 um. e, Model: Following activation on midzone microtubules, Aurora B remains active until dephosphorylation by cytosolic phosphatases. The resulting phosphorylation gradient (contour lines) extends from the midzone to the cortex (yellow ovals -Aurora B complex, yellow ovals with star - active Aurora B complex, teal ovals-phosphatase).

