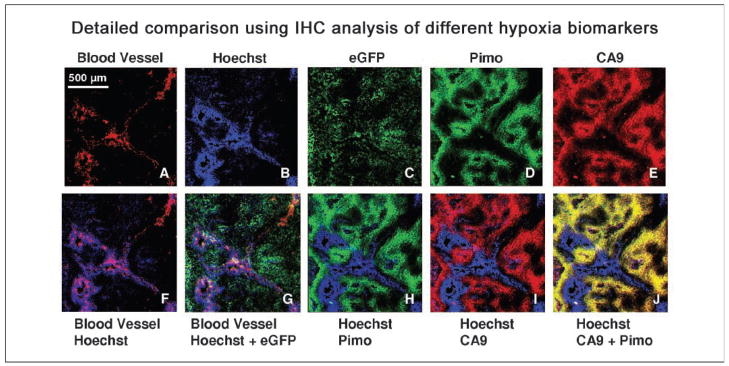
Figure 5.
Detailed comparison of the different biomarkers in a #C53 xenograft. Top (from left to right), (A) lectin-TRITC (functional blood vessels), (B) Hoechst (perfusion), (C) eGFP, (D) pimonidazole, and (E) CA9. Bottom, merged images (from left to right), (F) lectin-TRITC (functional blood vessels in red) and Hoechst (perfusion in blue); (G) eGFP (green), blood vessels (red), and perfusion (blue); (H) pimonidazole (green) and Hoechst (blue); (I) CA9 (red) and Hoechst (blue); (J) CA9 (red) and pimonidazole (green) resulting in yellow regions where the two markers colocalize. All images were obtained from the same section and scanned at ×50 magnification. Section was first imaged for eGFP, lectin-TRITC, and Hoechst, then stained for pimonidazole and CA9. Control experiment showed that TRITC and eGFP did not interfere with Alexa 568 and FITC signals, respectively (data not shown). Pimonidazole at higher doses (300 mg/kg) have been reported to interfere with blood flow in KHT tumors growing in mice (48). However, at the dose of 80 mg/kg, perfusion images of HT29 tumors did not indicate a loss of blood flow (49).

