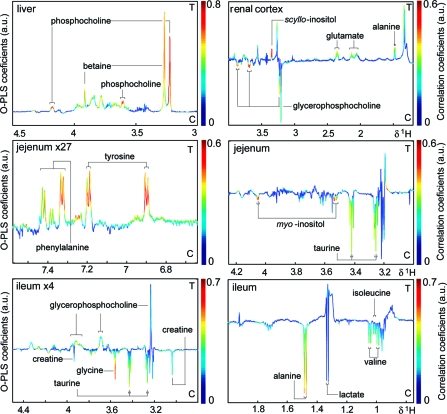
Figure 2.
Selected HR-MAS 1H NMR spectral regions in liver, renal cortex, jejunum, and ileum O-PLS-DA analysis. For illustrative purposes, a standard 1D pulse program was chosen for spectral analysis in liver, kidney and the jejunum aromatic region, whereas the CPMG data expressed the low molecular weight components, which mainly accounted for class differentiation in the ileum and the aliphatic region of the jejunum. The color bars indicate maximal contribution of the class separating metabolites in arbitrary units (a.u.).

