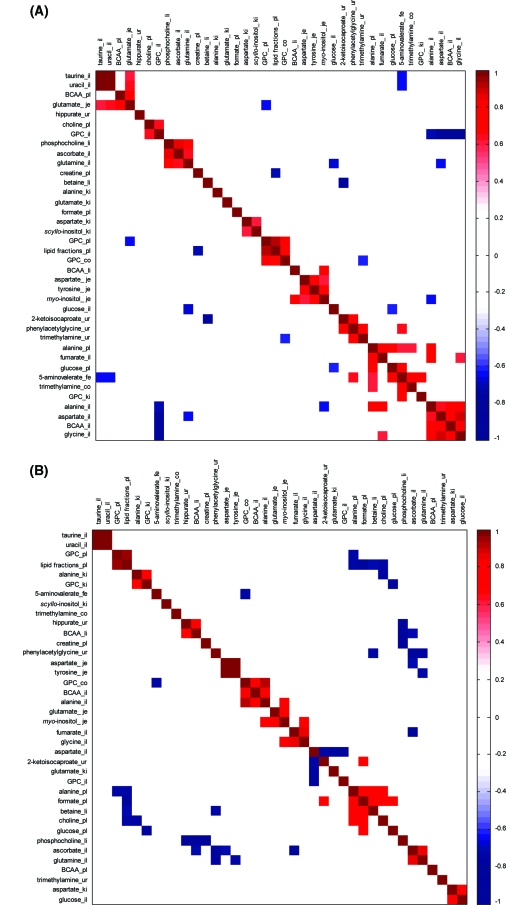
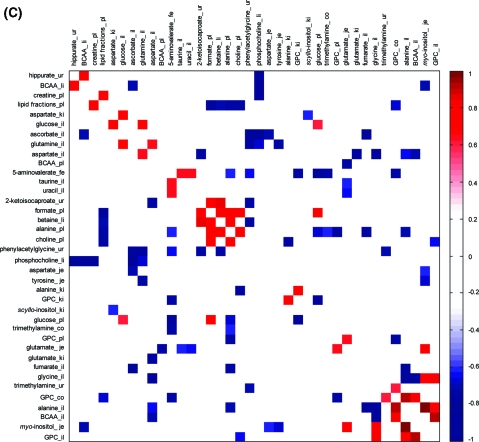
Figure 5.
Cluster analysis based on E. caproni infection-induced metabolic interactions between 8 assessed biological matrices. (A) Correlation structure of control animals demonstrating natural variation due to genetic and experimental individual background; (B) correlation structure composed of inherent individual variation and the effects of an infection; (C) differential cluster matrix showing only the remaining effects of the E. caproni infection. Key: co, colon; fe, fecal water; il, ileum; je, jejunum; ki, kidney; li, liver; pl, plasma; ur, urine. Statistically significant pairwise correlations between metabolite levels with p < 0.05 were explored in the analysis.


