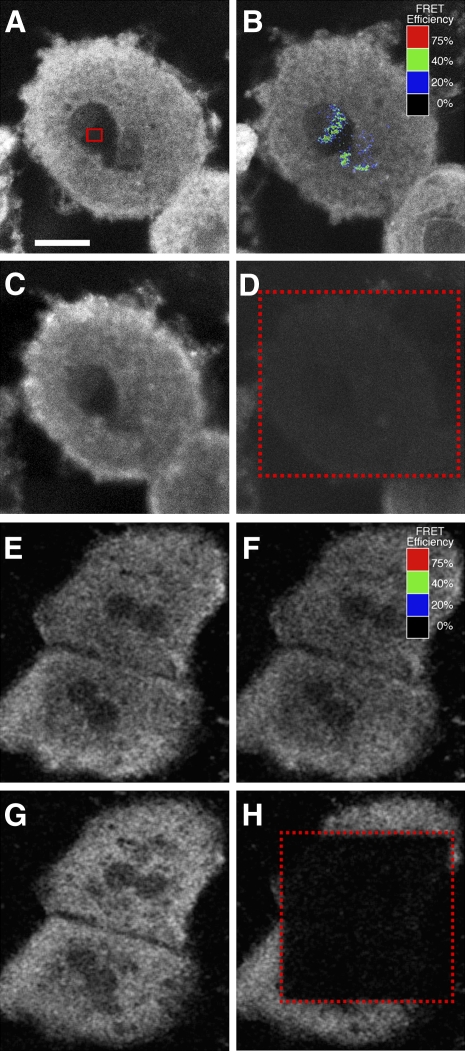
Fig. 6.
Double immunofluorescence labeling and FRET confocal microscopy of L-FABP and PPARα interaction in cultured primary hepatocytes. Cultured primary hepatocytes were fixed and double immunostained with Cy3-anti-L-FABP and either Cy5-anti-PPARα (A–D) or Cy5-anti-SREBP-1 (E–H) for FRET confocal microscopy as described in Materials and Methods. A: Cy3-anti-L-FABP fluorescence emission upon excitation at 488 nm before photobleaching of Cy5-anti-PPARα. The red box indicates the region within the nucleus where the greatest amount of energy transfer was detected. B: Cy3-anti-L-FABP fluorescence emission upon excitation at 488 nm after photobleaching of Cy5-anti-PPARα at 647 nm. The colored pixels overlaying the cell nucleus indicate the level of FRET efficiency. The scale correlates overlay colors to the level of FRET efficiency. C: Cy5-anti-PPARα fluorescence emission upon excitation at 647 nm before photobleaching at 647 nm. D: Cy5-anti-PPARα fluorescence emission upon excitation at 647 nm after photobleaching at 647 nm. The red rectangle indicates limits of the region bleached by 647 nm laser irradiation. E: Cy3-anti-L-FABP fluorescence emission upon excitation at 488 nm before photobleaching of Cy5-anti-SREBP-1. F: Cy3-anti-L-FABP fluorescence emission upon excitation at 488 nm after photobleaching of Cy5-anti-SREBP-1 at 647 nm. The colored pixels (black) overlaying the cell nucleus indicate the level of FRET efficiency. The scale correlates overlay colors to the level of FRET efficiency. G: Cy5-anti-SREBP-1 fluorescence emission upon excitation at 647 nm before photobleaching at 647 nm. H: Cy5-anti-SREBP-1 fluorescence emission upon excitation at 647 nm after photobleaching at 647 nm. The red rectangle indicates limits of the region bleached by 647 nm laser irradiation. Bar = 10 μm.

