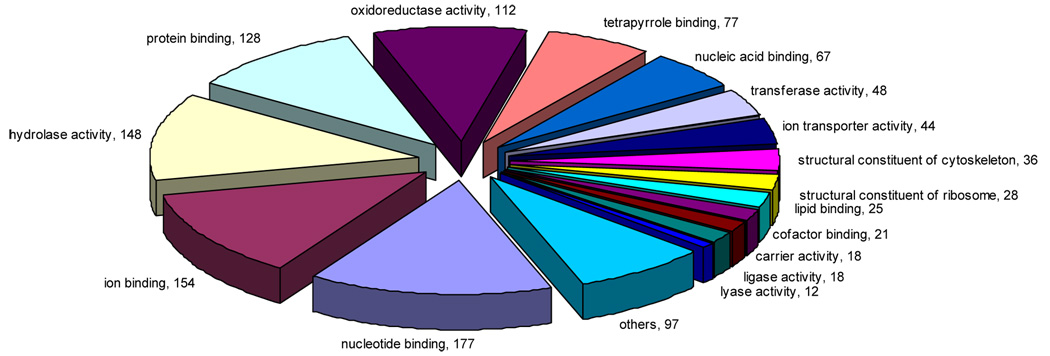
Figure 4. Gene Expression profile of Biomphalaria glabrata using Gene Ontology.
Values indicate the number of ORESTES categorized into the third molecular function ontology level, and include data from all groups. Only the sixteen most abundant categories are presented. Analysis based on 1210/3123 ORESTES assigned a GO term.

