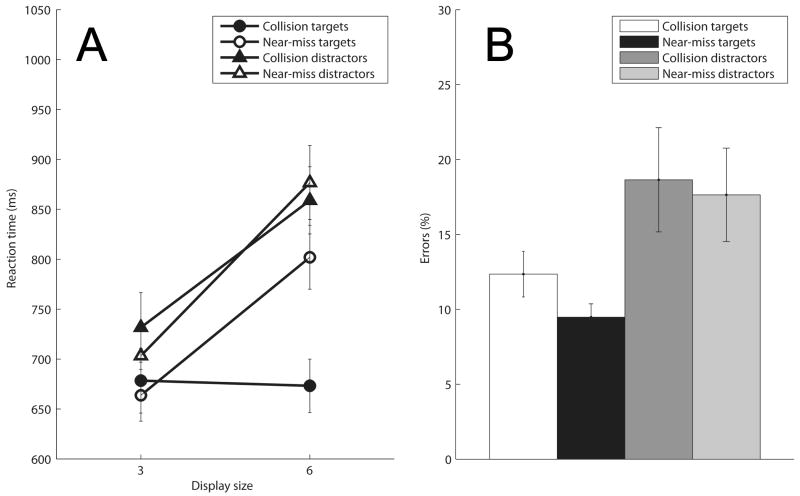
Figure 1. Mean correct response times and error rates in Experiment 1.
(A) Collision targets and near-miss targets represent trials where the final position of the looming items coincided with the location of the target ovals. Collision distractors and near-miss distractors represent trials where the final position of the looming item was at a location away from the location of the target oval. Increased search efficiency was evident in the rate of search as indexed by search slopes: rates of search were fastest for collision targets (-1.7 ms/item), and were much slower for near-miss targets (46.1 ms/item), collision distractors (42.4 ms/item) and near-miss distractors (57.8 ms/item). A significant three-way interaction of position, path, and display size (F(2,7) = 7.56, p = 0.019, MSE = 2005.71) indicates significant differences in the slopes across the four path/position combinations. Error bars represent s.e.m.
(B) Error rates for the different conditions of Experiment 1 are presented in Figure 1B. Error bars represent s.e.m.

