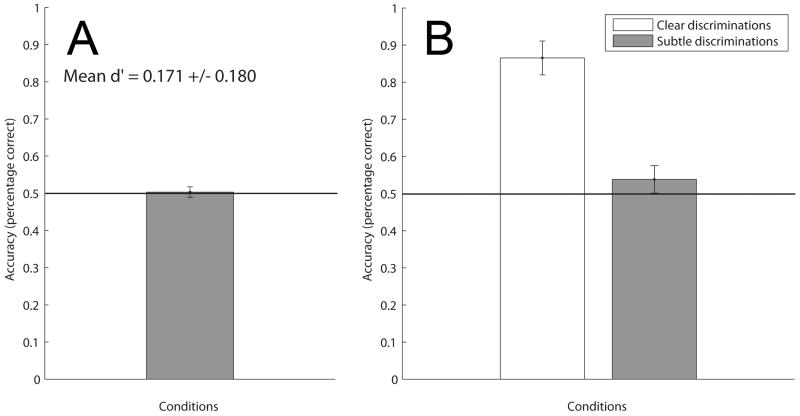
Figure 3. Mean accuracies for Experiment 2.
(A) Mean accuracy (50.33 +/- 0.0141%) and mean sensitivity (d′ = 0.171 +/- 0.180) for discriminating the trajectory of the subtle looming items are plotted from the results of Experiment 2A. Participants were instructed to fixate at the center, attend to the looming items and identify whether the looming trajectory was closer to a collision or near-miss with their head. Error bars represent s.e.m (p = 0.001).
(B) Mean accuracy (86.54 +/- 0.0457%) for discriminating between the “clear trajectories” and mean accuracy (53.82 +/- 0.0370%) for discriminating between the “subtle trajectories” used in Experiment 1 are plotted from the results of Experiment 2B. Error bars represent s.e.m. Results suggest that participants understood the task and could discriminate clear collision from miss trajectories; however, participants were unable to categorize the subtle looming trajectories presented in Experiment 1, p < 0.05.

