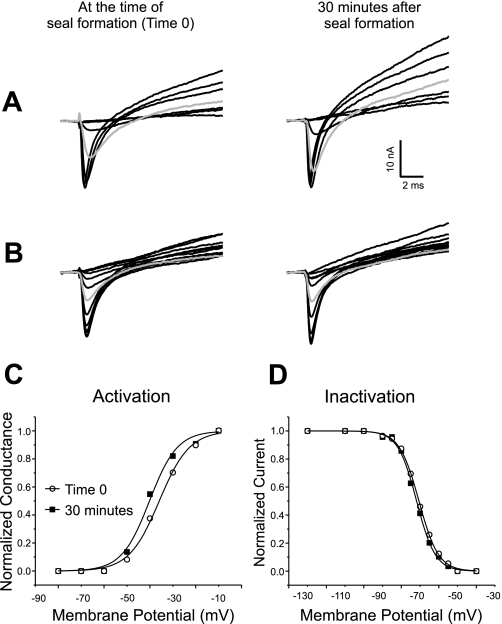
Fig. 3.
Voltage dependence of sodium channel gating is stable during loose patch recording when muscle fibers are not impaled during the recording. A: superimposed sodium current traces evoked by 10-ms pulses ranging from −80 to −10 mV. Shown are records from a muscle fiber 0 and 30 min after formation of a seal. At time 0 the first current is evoked by a step to −50 mV. At 30 min the first current is still evoked by a step to −50 mV. At 30 min the current evoked by a step to −40 mV (shaded trace) is slightly larger than at time 0. The patch was held at −110 mV between voltage protocols. One difference between the current traces shown in this figure, and those shown in Fig. 1 is the amplitude of the outward potassium current. In Fig. 1 no potassium current is present, whereas in the traces shown here, large potassium currents are evoked. We have previously reported that potassium current amplitudes are highly variable from patch to patch (10) and this did not appear to be related to impalement. B: superimposed sodium current inactivation records from the same fiber as in A and at the same times following impalement as in A. The currents were evoked by a step to −30 mV following prepulses ranging from −130 to −40 mV. Both at time 0 and at 30 min, a prepulse to −70 mV (shaded trace) inactivates slightly more than half of the sodium channels. C: normalized sodium conductance calculated from the currents shown in A with an assumed sodium reversal potential of +45 mV plotted versus membrane potential. The data are fitted with a Boltzman distribution at each time point. In the example shown there is a 4-mV hyperpolarized shift in the midpoint of activation over the course of the recording. D: normalized current amplitude of the currents shown in B are plotted and fitted with a Boltzman distribution at each time point. There is no shift in the midpoint of inactivation during the recording.

