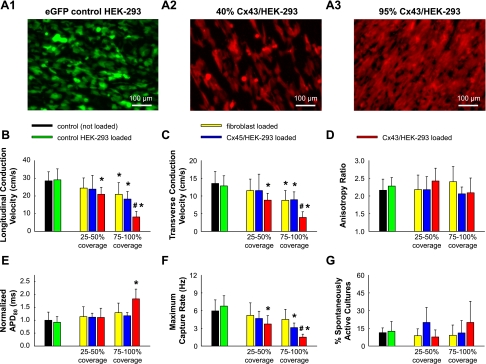
Fig. 5.
Effect of control HEK-293, Cx45/HEK-293, and Cx43/HEK-293 cell loading on cardiac electrophysiological parameters. A1–A3: live fluorescent images of anisotropic cardiac monolayers covered with enhanced green fluorescent protein (eGFP)-transfected control HEK-293 cells (35–50% coverage, n = 16; A1), mCherry and Cx43-transfected HEK-293 cells at medium (25–50%, n = 13; A2)- and high (75–100%, n = 5; A3)-density coverage, or mOrange and Cx45-transfected HEK-293 cells at medium (25–50%, n = 10)- and high (75–100%, n = 9)-density coverage (not shown). B–G: comparison of electrophysiological parameters for low and high coverage loading by cardiac fibroblasts (yellow), Cx45/HEK-293 cells (blue), and Cx43/HEK-293 cells (red) relative to loading by control HEK-293 cells (green) and no loading (black). *Significant difference from the not loaded and control HEK-293-loaded monolayers (P < 0.05). #Significant difference from the same coverage fibroblast-loaded monolayers (P < 0.05).

