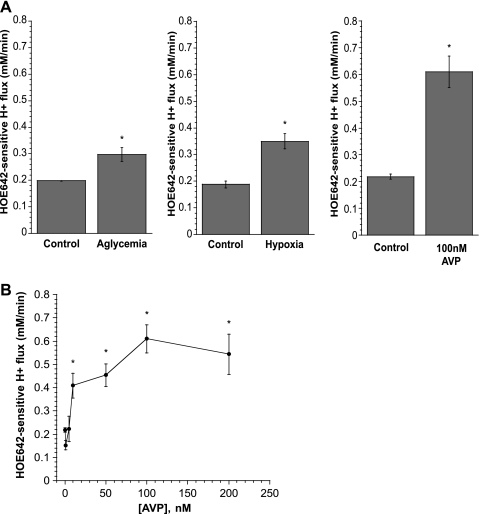
Fig. 5.
Effects of AVP, hypoxia, and aglycemia on CMEC NHE activity measured as HOE-642-sensitive H+ flux. A: confluent CMEC monolayers grown on glass coverslips were exposed for 30 min to glucose or glucose-free medium (left), hypoxic (∼2% O2) or normoxic (middle) medium, or 0 or 100 nM AVP (right), and NHE activity was assessed. Values are means ± SE of 4 experiments each for control and aglycemia, 3 experiments each for control and hypoxia, and 6 and 3 experiments for control and 100 nM AVP, respectively. *Significantly different from control: P < 0.03, P < 0.05, and P < 0.0001 for aglycemia, hypoxia, and AVP, respectively (Student's t-test). B: CMEC monolayers were exposed to 0–200 nM AVP for 5 min, and NHE activity was assessed as HOE-642-sensitive H+ flux. AVP was also present during the assay. Values are means ± SE of 3 experiments for each condition. *Significantly different from control (i.e., 0 nM AVP): P < 0.013, P < 0.002, P < 0.0001, and P < 0.0001 for 10, 50, 100, and 200 nM AVP, respectively.

