Fig. 4.
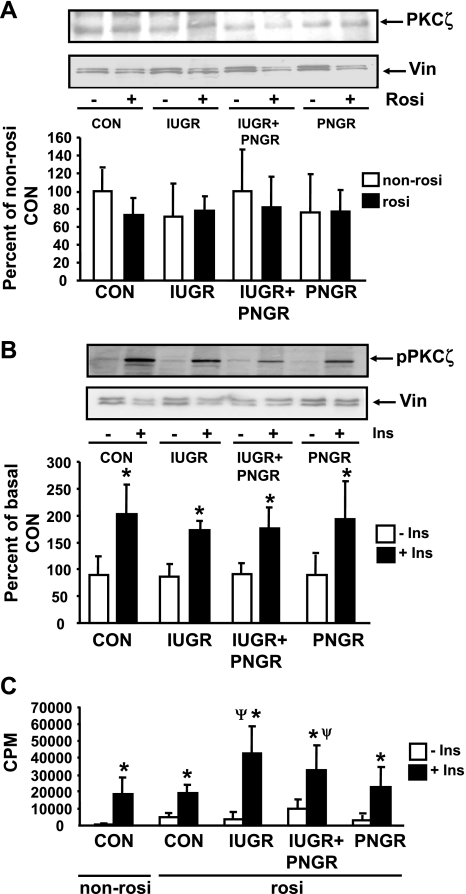
Skeletal muscle total and phosphorylated (p) PKCζ concentrations and enzyme activity. Top: representative Western blots demonstrating total PKCζ and vinculin (internal control) in non-Rosi (−) and Rosi (+) pretreatments (A) and pPKCζ and vinculin (internal control) in the basal (−Ins) and insulin-stimulated (+Ins) states of the 4 Rosi-pretreated experimental groups (B). Bottom: densitometric quantification of the protein bands of interest/vinculin shown as % of either the non-Rosi-pretreated Con (A) or basal state of Con (B); presented as means ± SD (n = 6 per Rosi or non-Rosi treatments, per basal or insulin-stimulated states per experimental group in A and B). C: PKCζ activity in basal (−Ins) and insulin-stimulated (+Ins) states of non-Rosi and Rosi pretreatments is shown as cpm/min (means ± SD; n = 6 per basal or insulin-stimulated state and per experimental group). *P < 0.005 vs. corresponding basal state (−Ins) within the same experimental group; ψP < 0.02 vs. non-Rosi- and Rosi-pretreated Con insulin-stimulated state (+Ins).

