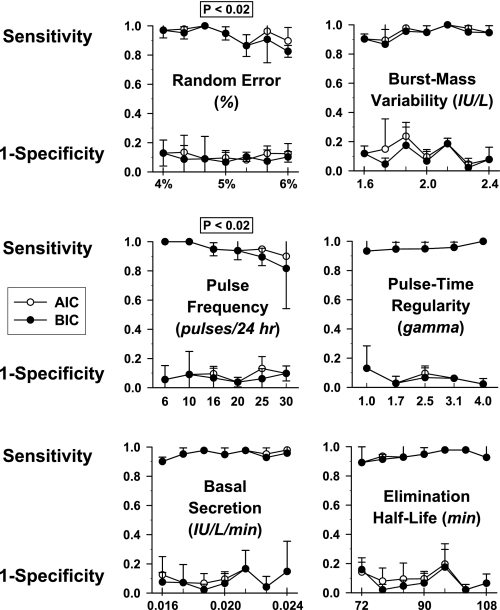
Fig. 6.
Parameter sensitivity analysis using mathematical simulations of LH pulse trains. Simulation parameters were progressively varied in 7 steps across a range of ±20%, viz., random error (top left), variability of secretory burst mass (top right), pulse frequency (middle left), regularity of pulse times (middle right), basal secretion (bottom left), and slow half-life (bottom right). Two significant outcomes were that increasing random error (top left) and pulse frequency (middle left) reduced pulse detection sensitivity (P < 0.02, Spearman rank correlation for each) but not specificity over the ranges explored. Each datum is the mean (± SD) sensitivity and 1-specificity calculated from a single set of simulation parameters realized in triplicate time series. Sensitivity and specificity were ascertained by AIC (○) and BIC (•).

