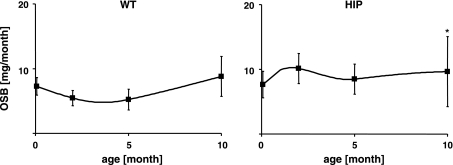
Fig. 6.
Uncertainty of the calculated other sources of β-cell mass. Time profile of OSB in WT (left) and HIP rats (right). Error bars are SE of OSB obtained by propogating the interrat variability. OSB was significantly different from 0 at all time points except at 10 mo of age in HIP rats, when variance was high (*OSB vs. 0, P < 0.05).

