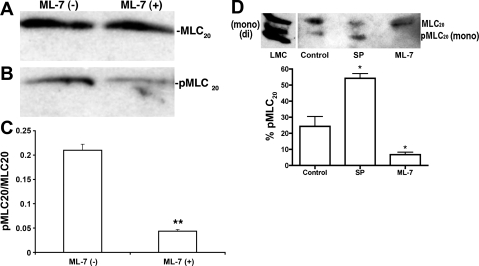
Fig. 8.
Quantitative analyses of pMLC20 to MLC20 in lymphatics. A and B: representative antibody reaction blots for the relative levels of MLC20 (A) and pMLC20 (B) in protein samples from ML-7 (10−5 M)-treated or untreated lymphatic vessels. C: signal intensities for MLC20 and pMLC20 from three different blots were used for the quantitative analysis. **P ≤ 0.001, significant difference between untreated and ML-7-treated samples. D: MLC20 phosphoprotein analysis by urea-glycerol gel. Un, mono, and di represent the unphosphorylated, monophosphorylated, and diphosphorylated forms of MLC20. Top, representative antibody reaction blot for the relative levels of MLC20 and pMLC20 in samples treated with either SP (10−7 M) or ML-7 (10−5 M) after urea-glycerol gel electrophoresis. LMC, lymphatic muscle cells. Bottom, quantitative analysis for the percentage of pMLC20, which was calculated as described in materials and methods from three different blots. *P ≤ 0.05, significant difference between untreated (control) and SP- or ML-7-treated samples.

