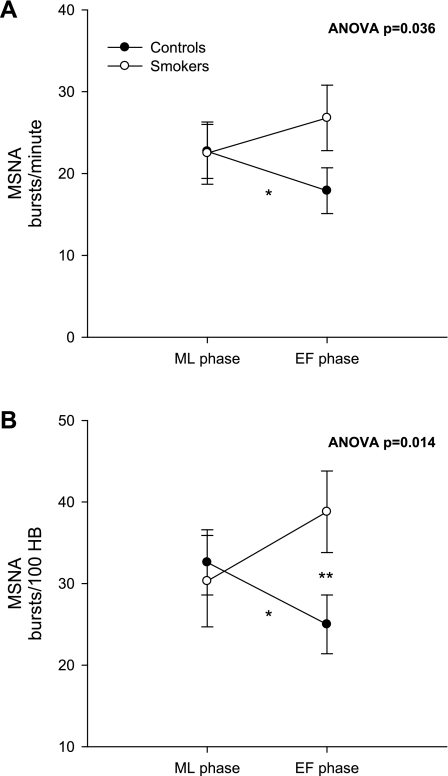
Fig. 2.
Muscle sympathetic nerve activity (MSNA) during the ML and EF phases of the ovarian cycle. In A, MSNA is quantified as bursts per minute during the ML and EF phases in controls and smokers. In B, MSNA is quantified as bursts per 100 heart beats (bursts/100 HB) during the ML and EF phases. A single asterisk indicates a significant within-group difference in MSNA during the ML vs. EF phase in controls; a double asterisk indicates a significant between-group difference in MSNA during the EF phase in controls vs. smokers. The overall ANOVA F-test indicated a significant difference in ovarian pattern of MSNA between the 2 groups when quantified as bursts/min (A; P = 0.036) and bursts/100 HB (B; P = 0.014).

