Fig. 1.
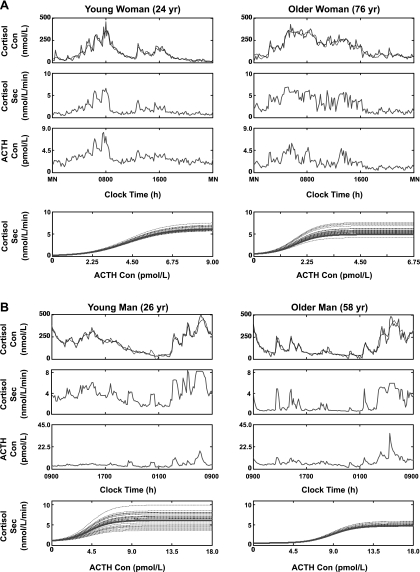
Illustrative ACTH-cortisol concentration-secretion profiles and dose-response estimates in a young and older woman (A) and a young and older man (B). Top row: measured plasma cortisol concentrations sampled every 10 min over 24 h (dark lines) and model-estimated values (light lines) (multiply nmol/l cortisol by 0.0363 to obtain μg/dl). Upper-middle row: cortisol secretion rates. Lower-middle row: ACTH concentrations (multiply pmol/l by 4.5 to convert to ng/l or pg/ml). Bottom row: ACTH concentration dose-cortisol secretory-response curves reconstructed for the set of ACTH pulses identified in each subject (interrupted lines). The solid dark line is the subject's mean dose-response estimate over 24 h. Note different scales to visualize the dynamics.

