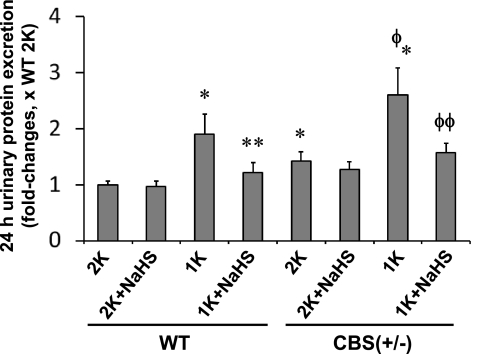
Fig. 3.
Role of H2S in homocysteine-associated proteinuria. Urinary protein was measured using Bradford method. *Significant difference (P < 0.05) compared with WT 2-K. **P < 0.05 vs. WT 1-K mice; Φ P < 0.05 vs. CBS(+/−) 2-K; ΦΦP < 0.05 vs. CBS(+/−) 1-K. Data represent the means ± SE, n = 8 animals per group.

