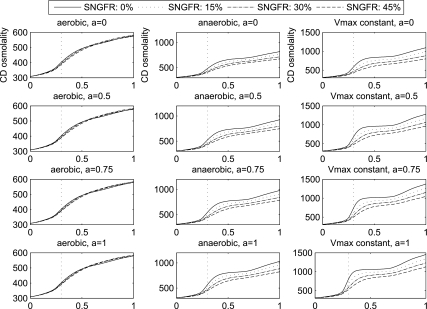
Fig. 9.
Profiles of OMCD tubular fluid osmolality (in mosmol/kgH2O) under hypertrophic conditions: aerobic, anaerobic, and “ideal” [maximum medullary thick ascending limb active Na+ transport rate is kept constant (Vmax constant)]. Note difference in y-axis scale among the 3 conditions. Each panel corresponds to a different value a (a = 0, 0.5, 0.75, and 1). Single-nephron glomerular filtration rate (SNGFR) is increased by 0%, 15%, 30%, and 45%.

