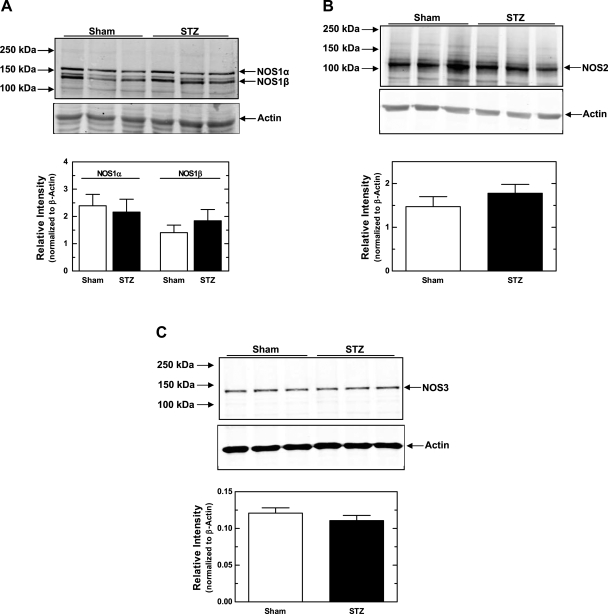
Fig. 4.
NOS1, NOS2, and NOS3 protein expression from mTAL homogenates from STZ and sham rats. A, top: representative Western blots of NOS1α, NOS1β, and β-actin. A, bottom: summary of Western blot data for NOS1α and NOS1β, each normalized to β-actin. B, top: representative Western blots of NOS2 and β-actin. B, bottom: summary of Western blot data for NOS2 normalized to β-actin. C, top: representative Western blots of NOS3 and β-actin. C, bottom: summary of Western blot data for NOS3 normalized to β-actin. Values are means ± SE (n = 7–14 rats).

