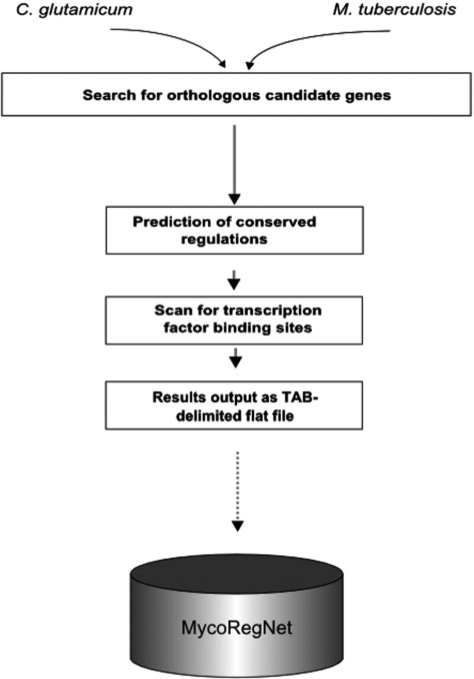
Figure 1.
Diagram of the prediction pipeline. The diagram shows the main steps performed during transfer of gene regulations from C. glutamicum to M. tuberculosis. Starting with an orthology detection, the next step was a prediction of conserved regulations. Based on that, a TFBSs prediction provided further evidence. Finally, the results can be exported as TAB-delimited files and imported into the MycoRegNet data repository.

