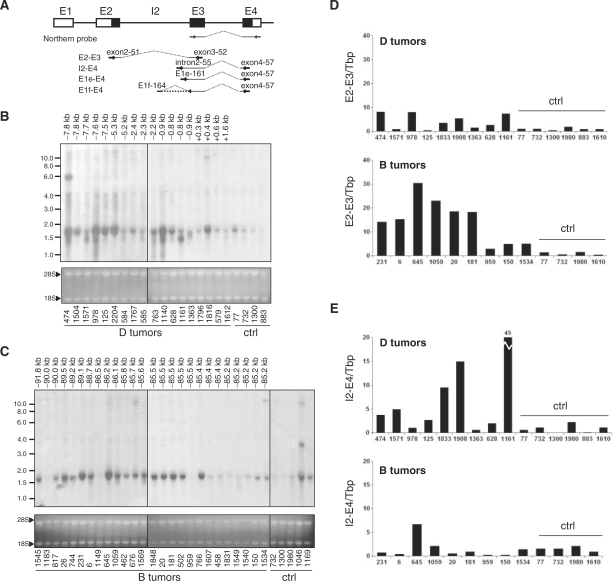
Figure 2.
Correlation of intragenic provirus insertion and appearance of Jdp2 intron 2 including transcripts. (A) Schematic representation of the localization of the Northern blot probe and QRT-PCR amplicons E2-E3, E2-E4, I2-E4, E1e-E4 and E1f-E4 for Jdp2 mRNA detection with exons shown as boxes and coding sequence in black. (B and C) Northern blotting on total RNA from thymus tumors from a subset of animals with integration in clusters D (B) and B (C) according to the retroviral tagging data. Control samples (Ctrl) are thymic tumors from retrovirus-infected animals of the same cohort in which no integrations were found by retroviral tagging. The distance between integration and the beginning of Jdp2 exon 3 for each tumor is shown above the lanes. Ethidium bromide staining of ribosomal bands 28S and 18S was used to evaluate even loading and RNA integrity. (D and E) QRT-PCR on a subset of D tumors and B tumors amplifying either Refseq Jdp2 mRNA (E2-E3) (D) or intron 2-including alternative mRNA (I2-E4) (E). The signal was normalized to Tbp and shown as fold difference to the average of control tumor samples (Ctrl).

