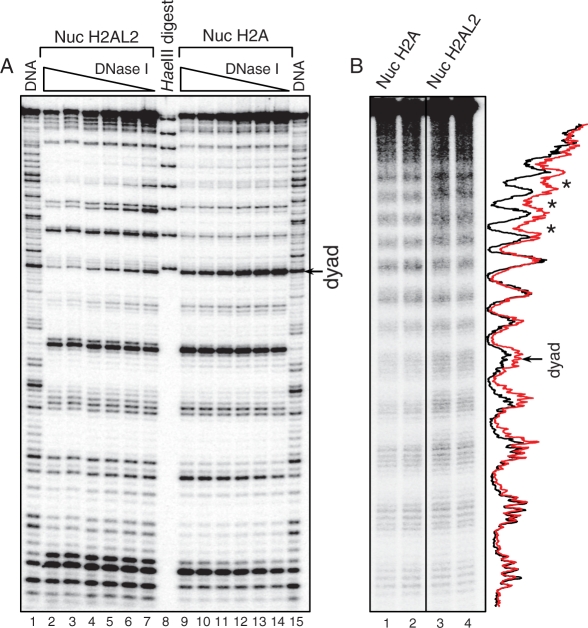
Figure 2.
DNase I and hydroxyl radical footprinting show alterations in the structure of the histone variant H2AL2 nucleosome. (A) DNase I footprinting. Conventional (lanes 2–7) and H2AL2 (lanes 9–14) nucleosome core particles were reconstituted by using 32P-radiolabeled 147 bp 601.2 positioning DNA sequence and digested with decreasing amount of DNase I. After purification, the cleaved DNA was run on an 8% sequencing PAGE. Lanes 1 and 15 show the DNase I digestion pattern of free DNA. The molecular marker (lane 8) is a HaeIII digested mix of the eight 147 bp 601.2 fragments; the band with the highest molecular weight corresponds to 147 bp and the consecutive bands are separated by 10 bp (see ‘Material and Methods’ section, one pot assay). The position of the nucleosome dyad is indicated at the right part of the figure. (B) Hydroxyl radical footprinting. Centrally positioned conventional and H2AL2 nucleosomes were reconstituted on 32P-radiolabeled 255 bp 601 positioning DNA sequence and subjected to OH cleavage. The cleaved DNA was purified from the conventional and H2AL2 nucleosomes and run (in duplicate) on 8% PAGE under denaturing conditions. Lanes 1 and 2 were not adjacent to lanes 3 and 4 in the original gel, and they were thus demarked accordingly. The right part of the figure shows the scans of the OH cleavage patterns of the two samples (red, H2AL2 nucleosomes; black, H2A nucleosomes). The position of the nucleosome dyad is indicated. Note the lower contrast of the cleaved H2AL2 nucleosomal DNA (designated by asterisk) toward the end of the nucleosome DNA.

