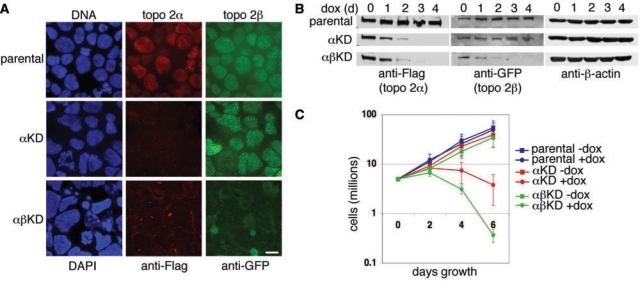
Figure 4.
(A) Indirect IF of topo 2α and topo 2β in the parental, αKD and αβKD cell lines after 6 days dox exposure. Cells were cytospun onto slides. Topo 2α was detected using anti-Flag antibody (Texas Red) and topo 2β using anti-GFP (FITC). DNA was counterstained using DAPI (blue). Scale bar, 10 μm. (B) Western blots showing robust knockdown, over 4 days dox exposure, of topo 2α in αKD cells and of both isoforms in αβKD cells. Topo 2α was detected using anti-Flag antibody and 2β using anti-GFP. β-actin was used as a loading control. (C) Growth curves of the parental (blue), αKD (red) and αβKD (green) cell lines grown in the presence (closed circles) and absence (closed squares) of 2.5 μg ml–1 dox for 6 days. Data points represent the mean (±SD) based on ≥3 independent experiments.

