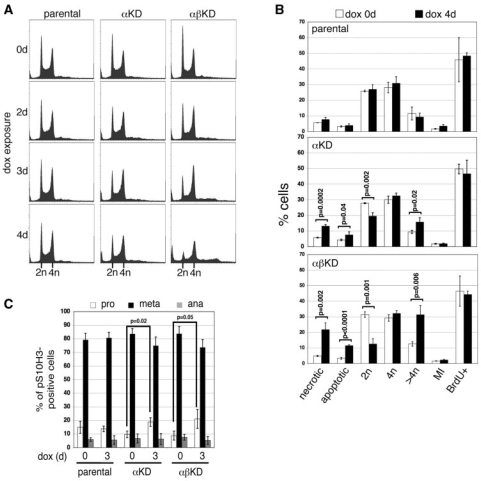
Figure 6.
(A) Flow cytometric analysis of nuclear DNA content of the parental, αKD and αβKD cell lines over a 4-day exposure to 2.5 μg ml–1 dox: x-axis, propidium iodide fluorescence; y-axis, events (total events 30 000). (B) Summary graph of flow cytometric cell cycle data collected from the parental, αKD and αβKD cell lines at 0 (white bars) and 4 days (black) dox. Data represents the mean (±SD) based on ≥3 independent experiments. (C) Breakdown of M phase cells (into prophase, prometa/metaphase and anaphase) at 0 and 3 days dox based on microscopic examination. Data points are the mean (±SD) of three experiments and are based on >300 pS10H3-positive cells.

