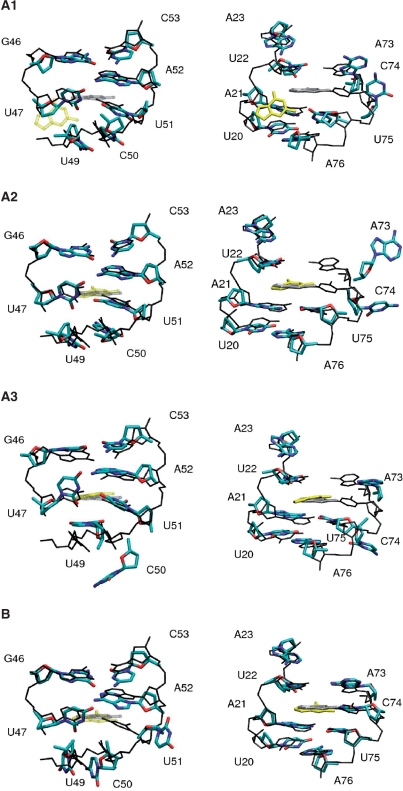
Figure 5.
Conformational rearrangements observed in various unbinding simulations of the guanine-bound G-riboswitch, using the distance between the ligand and riboswitch residue C74 (cases A1, A2, A3) and U51 (case B) as the pulling coordinate. The nonequilibrium structures (in color, bases and sugars only) are compared with equilibrium structures (in black and gray, hydrogen atoms and oxygen atoms of the phosphate groups are omitted). For clarity, left panels show only residues 20–23 and 73–76, while right panels show only residues 46–47 and 49–53.

