Figure 1.
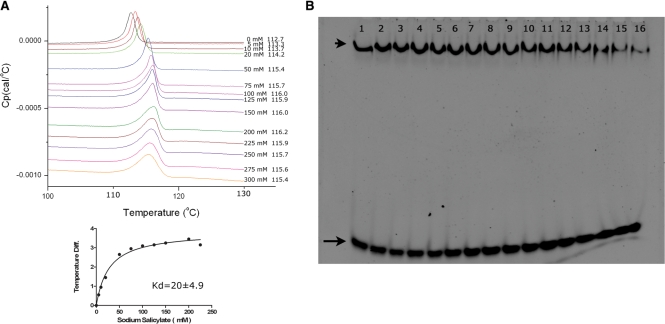
Salicylate binding and inhibition of ST1710–DNA complex assays. (A) DSC analysis of salicylate binding to ST1710. Typical excess heat capacity curves of ST1710 in the absence/presence of sodium salicylate ligand, at a scan rate of 90°C/hr. Salicylate concentration and peak temperature are noted on each curve. The binding constant was calculated using the non-linear regression fit, using the GraphPad Prism software. (B) Gel-mobility shift assay showing ST1710–DNA complex inhibition. All reactions were carried out in binding buffer containing 150 μM of protein and various amounts of sodium salicylate (to a final concentration of 0–250 mM; lanes 1–16 with 0, 1, 5, 10, 20, 30, 40, 50, 60, 70, 80, 90, 100, 150, 200 and 250 mM, respectively) were added and incubated at room temperature for 20 min. To this reaction mixture, 100 nM of 30-mer DNA added, and after for 20 min., the reactions were fractionated by 10% native PAGE and the DNA stained by SYBR Green (EMSA Kit, Invitrogen). The positions of the free and complex DNA are indicated by an arrow and an arrowhead, respectively.

