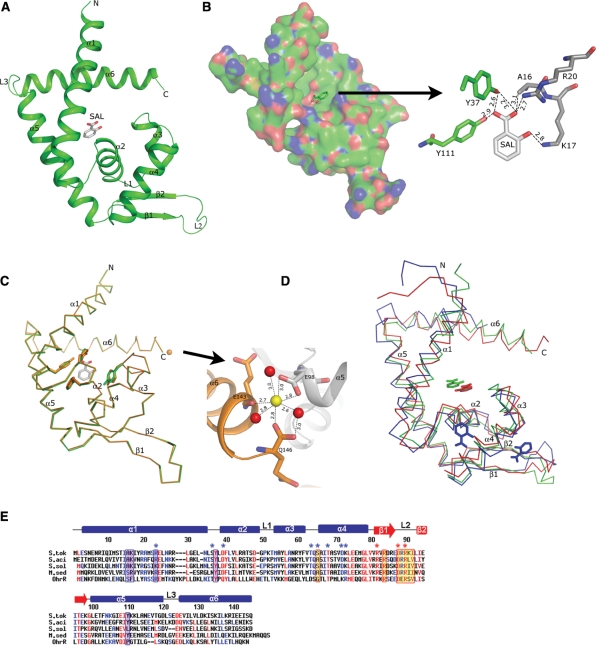
Figure 2.
Structure of ST1710 native and salicylate complex and sequence comparison with closely related proteins. (A) A ribbon diagram of the ST1710–salicylate complex. The secondary structure assignments and the N-/C- termini are labeled on the structure. The bound salicylate is shown in the stick model. (B) An electrostatic representation of the ST1710 monomer. The basic regions are shown in blue, and the acidic regions are red. Close-up view of salicylate binding site interactions with protein residues. The hydrogen bonds are indicated by broken lines. (C) Structural comparison of the ST1710–salicylate complex with the native structure. The native structure is shown in orange color. The salicylate and key residues involved in interactions are shown in stick models and the bound Ca2+ ion in the native structure is represented by an orange sphere. The Ca2+ ion binding site is enlarged. (D) Superimposition of the ST1710–salicylate complex along with another known MarR family protein crystallized with salicylate. The E. coli MarR is represented by blue color and M. thermoautotrophicum MTH313 is shown in red. (E) Sequence analysis of ST1710 (S. tok) and its closely related proteins from different species: S. acidocaldarius (S. aci), S. solfataricus (S. sol), and M. sedula (M. sed) along with the OhrR protein. Conserved residues are indicated by red letters. The secondary structural elements in the primary sequences of ST1710 are indicated as α-helices (bars), β-strands (arrows) and loops (lines). The salicylate and DNA contacting residues in ST1710 are shown in blue-shaded and yellow-shaded boxes, respectively. DNA contacting residues of the wing in OhrR are indicated by red asterisks. Selected homologous/identical residues that interact with DNA in OhrR are indicated by blue asterisks.

