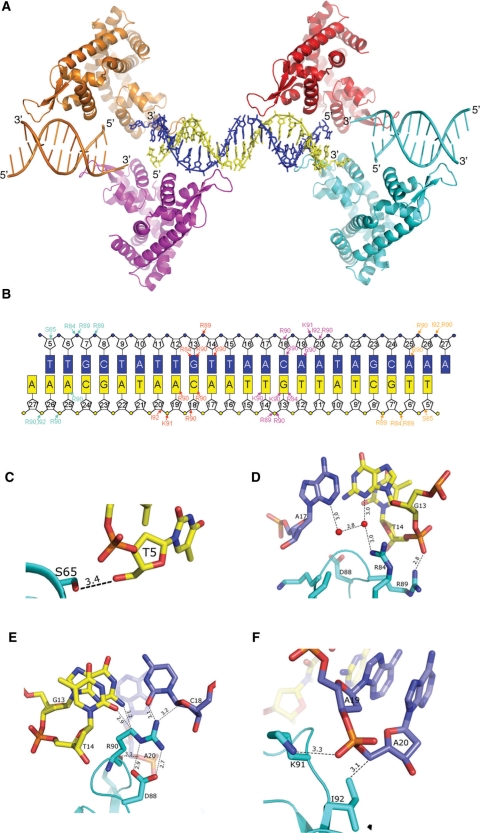
Figure 4.
ST1710–promoter DNA interactions. (A) A ribbon diagram of ST1710–DNA complex colored as in Figure 4E. The full-length promoter DNA is shown in stick model. The T5-A27 and T5′-A27′ strands are in blue and yellow, respectively. (B) Schematic representation showing all ST1710–DNA contacts. The bases are shown in rectangles. The protein–DNA contacts in each of the ST1710 monomer are represented by the same color in (A). (C–F) The close-up view of the critical protein–DNA interactions in the complex is shown in A–D. The residues of nucleic acids and protein are shown in stick models. The hydrogen bonds are shown in broken lines.

