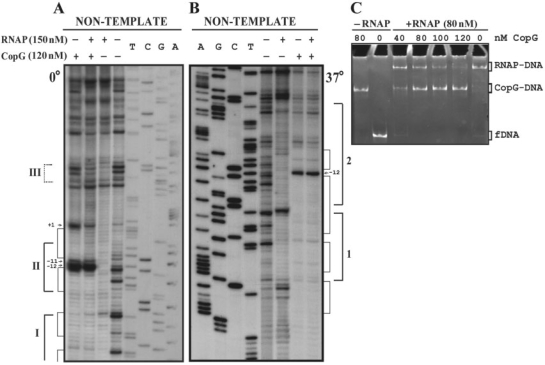
Figure 3.
CopG and RNAP compete for binding to the Pcr region. (A, B) DNase I footprinting of binding mixtures containing CopG and/or RNAP. Labelled DNA was incubated at 0°C (A) or 37°C (B) in the presence (+) or in the absence (−) of CopG and RNAP prior to digestion with DNase I. When both proteins were included, CopG was added before RNAP. Cleavage products on the non-template DNA strand are shown, with regions protected by CopG or RNAP indicated by thin or thick brackets, respectively. RNAP footprints are named as in Figure 1B. Enhancements due to CopG binding are indicated by arrows. Dideoxy sequencing reactions on the same DNA are included. (C) EMSA analysis of the complexes formed at 37°C in the presence of CopG and/or RNAP. Unlabelled DNA (10 nM) was incubated with the indicated concentrations of CopG prior to addition of RNAP. Samples were treated with heparin before loading onto the gel. Bands corresponding to free DNA (fDNA), and to CopG–DNA and RNAP–DNA complexes are indicated.

